

The Nasdaq has been the unparalleled leader of the stock market in 2020, having rallied furiously off the COVID-19 crash market bottom in March.
But all of the excitement around tech stocks and the comeback in the stock market may be coming to an end… that is, if a key Fibonacci price target has anything to do with it!
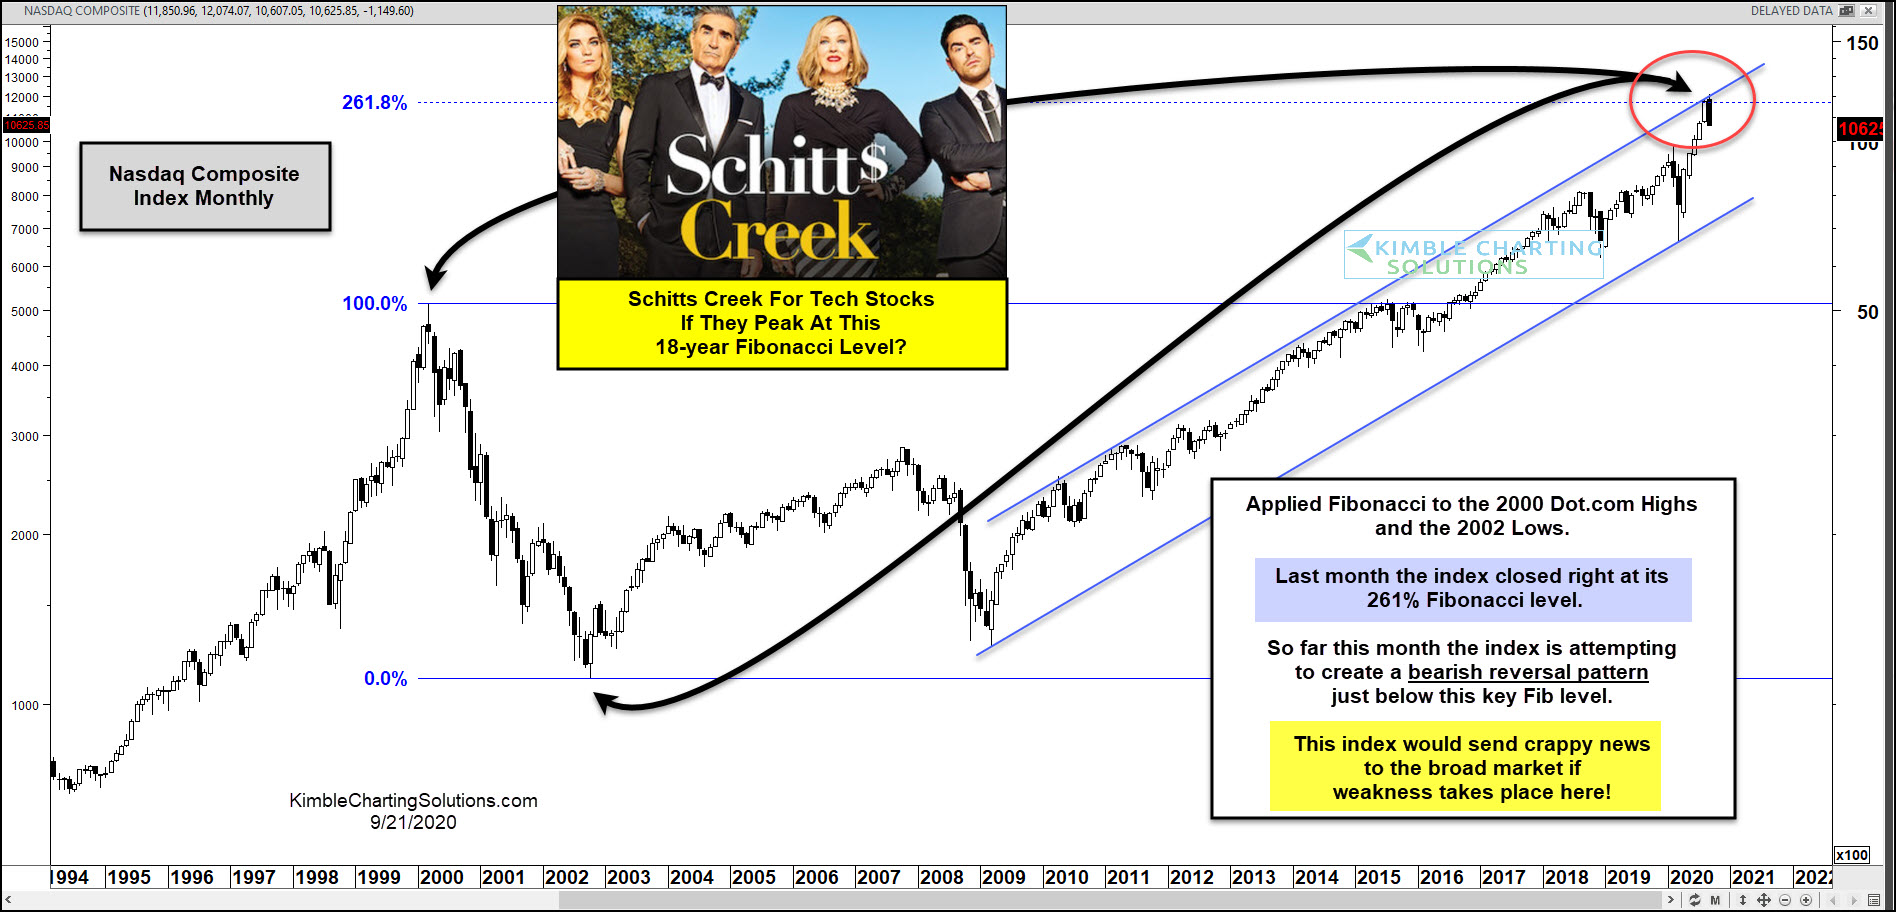
In today’s chart, we look at the long-term “monthly” chart of the Nasdaq Composite Index (IXIC) and focus in on the 18-year rally.
As you can see, the Nasdaq peaked in 2000 and bottomed in 2002. Applying Fibonacci to these levels, we have generated the 261.8 price target. Looking closer, you can see that the Nasdaq closed August right on that Fibonacci level and is currently creating a bearish reversal pattern this month (in September).
Could it be “Schitt's Creek” for technology stocks? Let’s just say that a bearish reversal here would send crappy news to the broader stock market.
(Click on image to enlarge)



Comments
Log in or sign up to join the conversation.