

In January, many traders noticed that there was a divergence between SPX and VIX. It’s true if we look at the price series. Graph below shows the 20-day rolling correlation between SPX and VIX prices for the last year. We can see that the correlation has been positive lately.
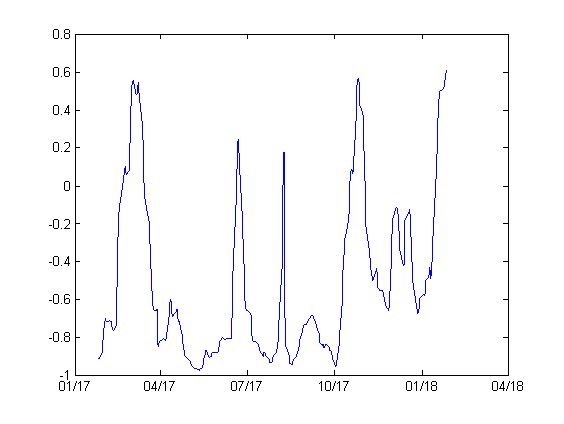
20-day rolling correlation SPX-VIX prices, ending Jan 26 2018
However, if we look at the correlation between SPX daily returns and VIX changes, it’s more or less in line with the long term average of -0.79. So the divergence was not significant.
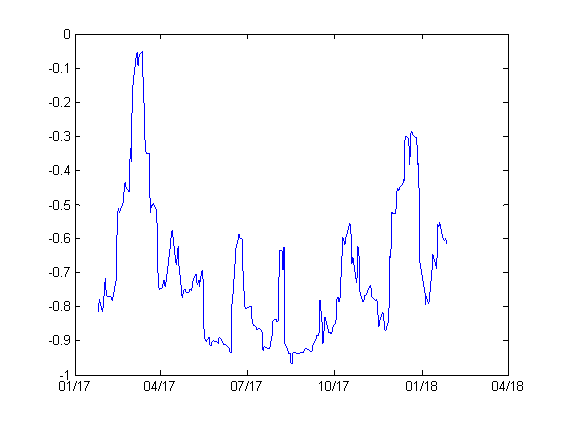
20-day rolling correlation SPX return -VIX changes ending Jan 26 2018
The implied volatility (VIX) actually tracked the realized volatility (not shown) quite well. The latter happened to increase when the market has moved to the upside since the beginning of the year.
See More Here: Correlation Between SPX and VIX


Comments
Log in or sign up to join the conversation.