Every stock in your portfolio plays a role. Most investors do not separate the workhorses from the bets they are still figuring out, and that confusion costs them the moment markets turn rough.
At Dividend Stocks Rock, we sort every name into one of three buckets: core holdings, educated guesses, and falling knives. The label captures the role the stock plays for me and how I expect to manage it. Get the role wrong and a 30% drop will scare you out of a great business. Get it right and the same drop becomes a buying opportunity.
Here is how the three buckets work, with two current examples in each.
What is a core holding?
A core holding is a stock you can own for ten years without checking the screen (but you still should!). Strong dividend triangle, sustainable payout ratio, durable moat, and capital allocation you trust. These names should make up 70% to 80% of a retirement portfolio.
I want the dividend triangle (revenue growth, earnings growth, dividend growth) clean. I want the payout ratio comfortable. I want a balance sheet that gives management room to keep paying through a recession. And I want a business model I can explain to a 12-year-old in two sentences.
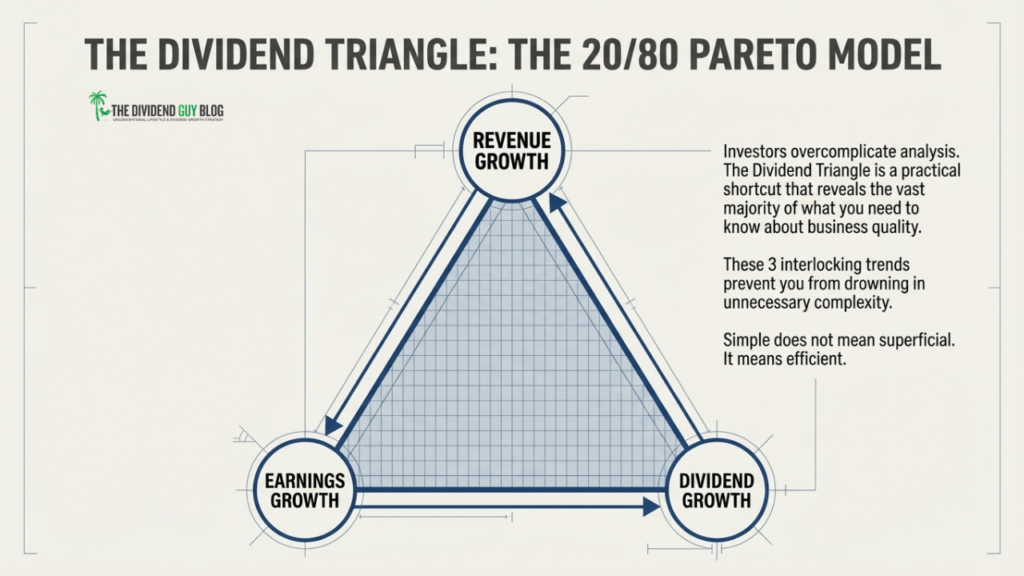
The Dividend Triangle is the Pareto Principle for Investors.
Mastercard (MA): A Real Tollbooth
Mastercard sits at the top of its category. PRO rating 5 of 5, Dividend Safety 5 of 5. The dividend triangle is one of the cleanest in the market. Payout ratio sits under 20%. Cash payout ratio is 17%.
The business model is a tollbooth. Every swipe puts a few cents in Mastercard’s pocket. The network effect runs decades deep. Cash, fraud, and crypto get the headlines, but the core machine keeps growing as commerce moves online and cross-border.
MA’s yield is nearly non-existent, which can be unattractive to income-seeking investors. However, it exhibits a double-digit dividend growth rate over the past five years. The forward yield is currently above the 5-year average. It does signal that the market is paying less for the same business than it has for most of the last decade. A 12% drop over the last 12 months gives long-term investors a rare entry point.
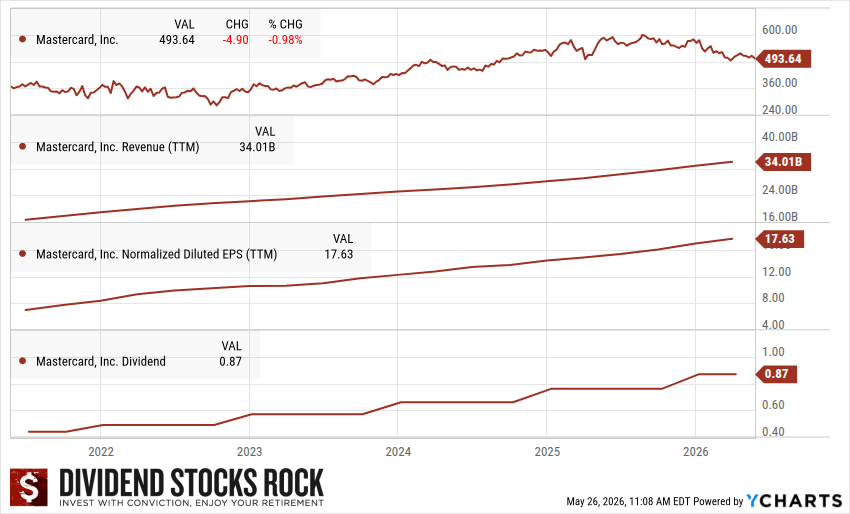
Mastercard (MA) 5-year dividend triangle chart.
Dollarama (DOL.TO): King of Operating Margins
Dollarama is the Canadian version of “do not overthink it.” PRO rating 5 of 5. The dividend triangle shows double-digit revenue, EPS, and dividend growth over five years. The yield is small. The growth is not.
The moat is procurement and scale. Dollarama buys in volume, controls its own private labels, and runs a footprint of more than 1,500 stores in Canada with a longer runway through its stake in Dollarcity in Latin America. Operating margins keep climbing. Same-store sales hold up in good and bad consumer environments.
If you want a Canadian compounder that has raised its dividend every year since 2011, this is one of the best names on the TSX. I do not check on Dollarama between earnings calls. That is the point of a core holding.
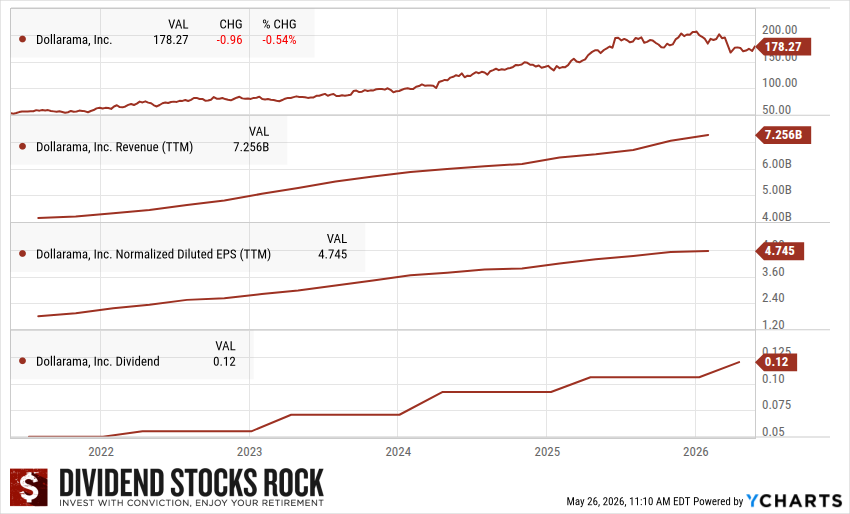
Dollarama (DOL.TO) 5-year dividend triangle chart.
What is an educated guess?
An educated guess is a stock close to core quality, with one visible flaw. Maybe the dividend triangle has cracks. Maybe debt is creeping up. Maybe the business is in a cyclical patch. The thesis is intact, but the metrics are not where I want them for a “set and forget” position.
I keep educated guesses in industries I know well. They need more monitoring than core holdings. Their status can flip in a quarter or two, either back up to core or down to falling knife.
Union Pacific (UNP): A Slowing Dividend Growth
Union Pacific is a high-value educated guess. PRO 3, Safety 3. The triangle is mixed: revenue 5-year growth 3.6%, EPS 5-year growth 6.4%, dividend 5-year growth 6.6%. The streak is 17 years. The flaw is recent: dividend hikes and revenue have slowed. That is a warning shot.
The thesis is still strong. North American rails are an oligopoly. Trucks cannot replace the cost advantage of moving heavy freight by rail. UNP is now working through a merger with Norfolk Southern that would create the first true coast-to-coast US railroad. If management executes, the situation could change.
P/E sits at 21.9 versus a 5-year average of 21.6. Forward P/E at 20.5. Forward yield of 2.08% is below the 5-year average of 2.34%. The market is not giving away the rails. The question is whether the merger and freight recovery turn the dividend triangle back up.
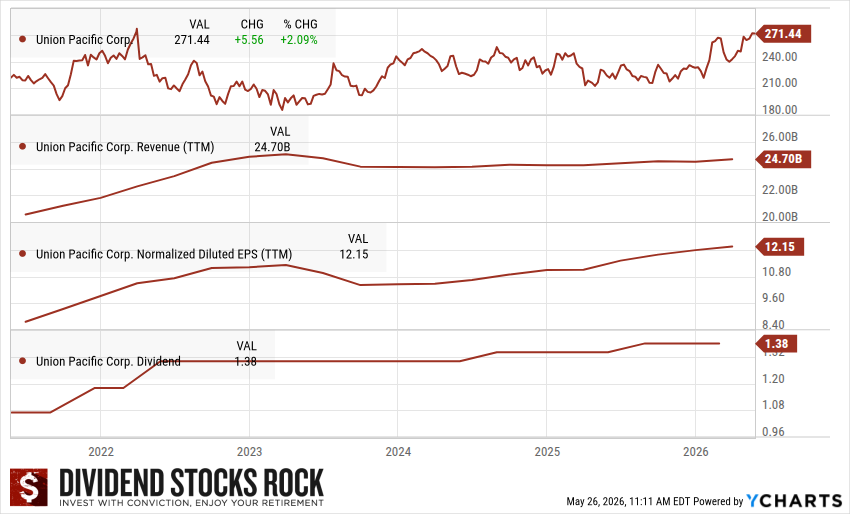
Union Pacific (UNP) 5-year dividend triangle chart.
Bank of Nova Scotia (BNS.TO): Weaker than Its Peers
BNS is what an educated guess looks like in a Canadian bank. PRO 3, Safety 3. The streak reset to 3 years after the 2024 dividend freeze.
BNS is not a bad bank. It’s simply weaker than its Canadian peers. The reason I keep watching is that CEO Scott Thomson is running a credible restructuring. He has trimmed Latin America, taken a stake in KeyCorp to build out US exposure, and is shifting capital to higher-return businesses. The forward P/E of 12.4 sits in line with peers. The forward yield of 4.0% is well below the 5-year average of 5.7%, suggesting the market already gives BNS some credit for the turnaround.
If the dividend triangle starts climbing again in 2026 and 2027, BNS moves back to a 4. If it stalls, the rating drops. This is a position to monitor quarter by quarter, not a stock to forget.
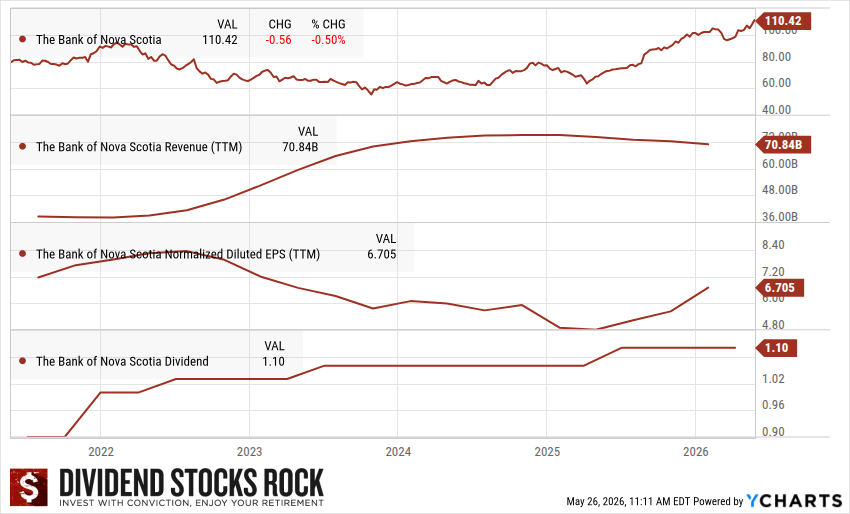
Bank of Nova Scotia (BNS.TO) 5-year dividend triangle chart.
What is a falling knife?
A falling knife is a stock that has dropped 20 to 30 percentage points faster than the broader market, while the underlying business is also deteriorating. The dividend triangle is broken or breaking. The payout ratio is unsustainable. A dividend cut is on the table, or has already happened.
Falling knives feel cheap, and that is the trap. A stock down 70% can fall another 70%. A 12% yield is a signal, not income you will collect for long. The market is not stupid. When something looks too cheap to be true, the business is breaking faster than the price.
I rarely own falling knives. When I do, the position is small, and the thesis is specific.
Dollar General (DG): A Frozen Dividend Growth
Dollar General was once a defensive consumer staples darling. Today it is a PRO 2, Safety 2. The dividend growth has been frozen for two years. Dividend 1-year growth is zero. Dividend 3-year growth is 1.75%. EPS 5-year growth is negative 8.8%. Total return over five years is -45%.
The story people lean on, “rural discount moat,” still holds some truth. The problem is that the business model keeps under-earning. Shrink (theft and damaged inventory) hit margins hard. Staffing costs have climbed. Store-level execution has slipped. Every quarter, the company promises a turnaround. Every quarter, the earnings come in lighter than expected.
A 2.3% forward yield against a 5-year average of 1.9% is not enough compensation for the trend. There may be a value play here at some point, but why lose time on it when there are much better options on the market?
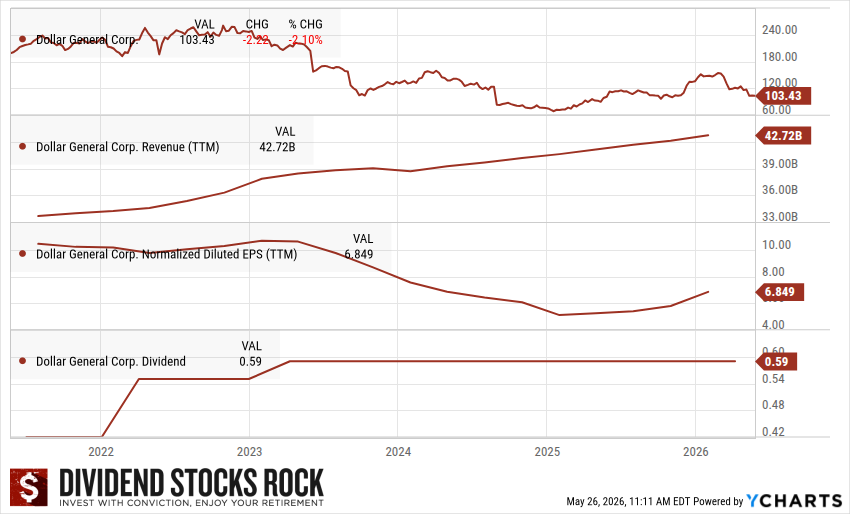
Dollar General (DG) 5-year dividend triangle chart.
Goeasy (GSY.TO): An Inverted Triangle
This one has quickly lost all its shine to a PRO 1. goeasy is paired with a Safety 1. The stock is down 75% over the last 12 months. The dividend yield has ballooned to 16% amid falling prices. The payout ratio reads zero because earnings have collapsed. Free cash flow yield is -35%. Debt to EBITDA above 15.
goeasy is a subprime lender. The business depends on a healthy credit cycle and on the company’s ability to underwrite loans to customers that other lenders will not touch. When the cycle turns, this is the kind of name that gets hit twice: rising defaults and tightening capital markets at the same time.
A 16% yield is a warning. The first rule on a falling knife is to look at the dividend triangle. If it is inverted, the price is telling you the truth, not lying.
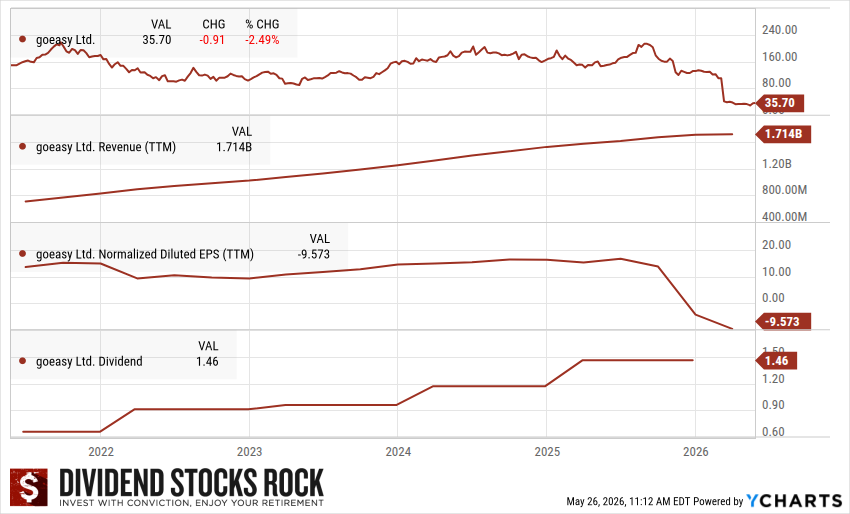
Goeasy (GSY.TO) 5-year dividend triangle chart.
How to use the three buckets in a portfolio
For an investor in the accumulation phase, all three categories can play a role, with weights heavy on core holdings. Educated guesses give you upside as ratings improve. Falling knives are rarely worth it unless you are prepared to be wrong for a long time.
For an investor in or near retirement, the case for anything but core holdings weakens fast. A retirement portfolio should hold 80% or more in core names. Educated guesses get smaller weights. Falling knives, in most cases, do not belong. Sequence-of-returns risk does not care about your contrarian thesis.


Comments
Log in or sign up to join the conversation.