

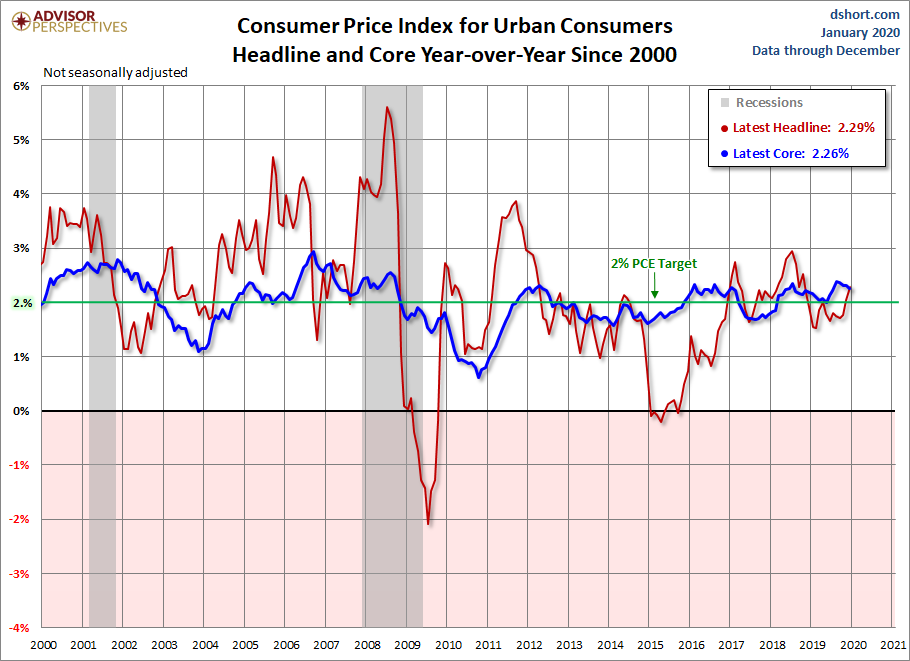
The Bureau of Labor Statistics released the December Consumer Price Index data this morning. The year-over-year non-seasonally adjusted Headline CPI came in at 2.29%, up from 2.05% the previous month. Year-over-year Core CPI (ex Food and Energy) came in at 2.26%, down slightly from the previous month's 2.32% and above the Fed's 2% PCE target.
Here is the introduction from the BLS summary, which leads with the seasonally adjusted monthly data:
The Consumer Price Index for All Urban Consumers (CPI-U) rose 0.2 percent in December on a seasonally adjusted basis after rising 0.3 percent in November, the U.S. Bureau of Labor Statistics reported today. Over the last 12 months, the all items index increased 2.3 percent before seasonal adjustment.
The indexes for gasoline, shelter, and medical care all rose in December, accounting for most of the increase in the seasonally adjusted all items index. The gasoline index increased 2.8 percent in December. Other major energy component indexes were mixed, and the energy index rose 1.4 percent. The food index rose 0.2 percent in December with the indexes for both food at home and food away from home increasing over the month.
The index for all items less food and energy rose 0.1 percent in December after increasing 0.2 percent in November. Along with the indexes for shelter and medical care, the indexes for apparel, motor vehicle insurance, recreation, and new vehicles all increased in December. The indexes for used cars and trucks, household furnishings and operations, and airline fares were among those to decline.
The all items index increased 2.3 percent for the 12 months ending December, the largest 12-month increase since the period ending October 2018. The index for all items less food and energy also rose 2.3 percent over the last 12 months, the same increase as the periods ending October and November. The food index rose 1.8 percent over the last 12 months, while the energy index increased 3.4 percent. [More…]
Investing.com was looking for a 0.3% MoM change in seasonally adjusted Headline CPI and a 0.2% in Core CPI. Year-over-year forecasts were 2.3% for Headline and 2.3% for Core.
The first chart is an overlay of Headline CPI and Core CPI (the latter excludes Food and Energy) since the turn of the century. The highlighted two percent level is the Federal Reserve's Core inflation target for the CPI's cousin index, the BEA's Personal Consumption Expenditures (PCE) price index.
The next chart shows both series since 1957, the year the government first began tracking Core Inflation.
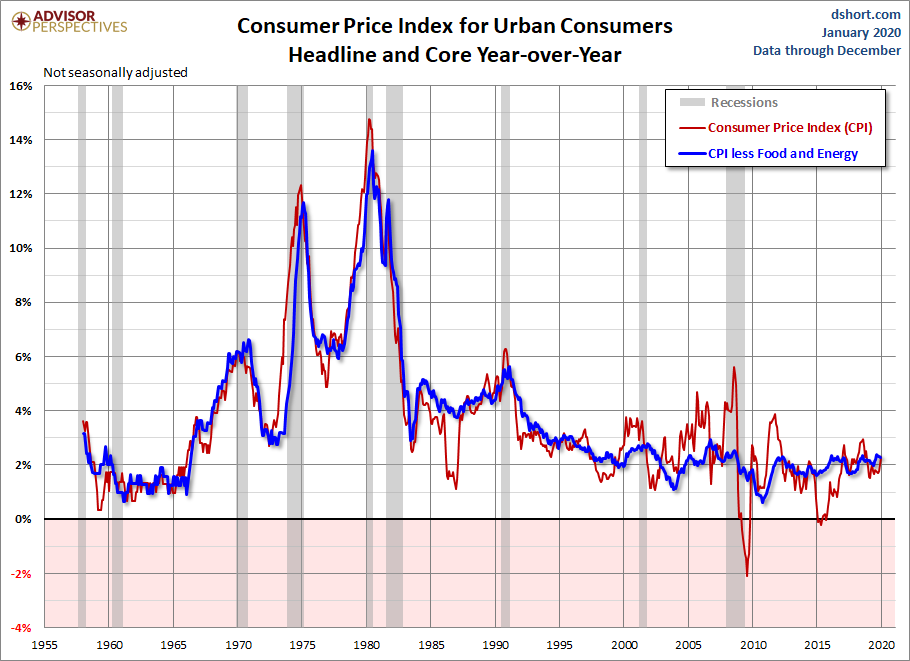
In the wake of the Great Recession, two percent has been the Fed's target for core inflation. However, at their December 2012 FOMC meeting, the inflation ceiling was raised to 2.5% while their accommodative measures (low Fed Funds Rate and quantitative easing) were in place. They have since reverted to the two percent target in their various FOMC documents.
Federal Reserve policy, which in recent history has focused on core inflation measured by the core PCE Price Index, will see that the more familiar core CPI is now at the PCE target range of 2 percent.



Comments
Log in or sign up to join the conversation.