

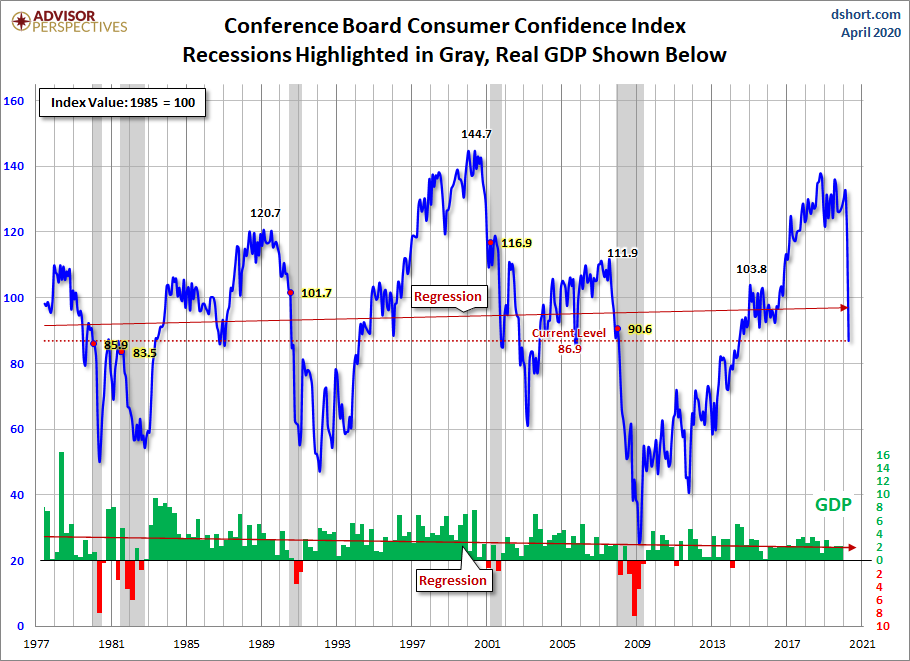
The headline number of 86.9 was a decrease from the final reading of 118.8 for March. Today's number was slightly below the Investing.com consensus of 87.9.
“Consumer confidence weakened significantly in April, driven by a severe deterioration in current conditions,” said Lynn Franco, Senior Director of Economic Indicators at The Conference Board. “The 90-point drop in the Present Situation Index, the largest on record, reflects the sharp contraction in economic activity and surge in unemployment claims brought about by the COVID-19 crisis. Consumers’ short-term expectations for the economy and labor market improved, likely prompted by the possibility that stay-at-home restrictions will loosen soon, along with a re-opening of the economy. However, consumers were less optimistic about their financial prospects and this could have repercussions for spending as the recovery takes hold. The uncertainty of the economic effects of COVID-19 will likely cause expectations to fluctuate in the months ahead.” Read more
Putting the Latest Number in Context
The chart below is another attempt to evaluate the historical context for this index as a coincident indicator of the economy. Toward this end, we have highlighted recessions and included GDP. The regression through the index data shows the long-term trend and highlights the extreme volatility of this indicator. Statisticians may assign little significance to a regression through this sort of data. But the slope resembles the regression trend for real GDP shown below, and it is a more revealing gauge of relative confidence than the 1985 level of 100 that the Conference Board cites as a point of reference.
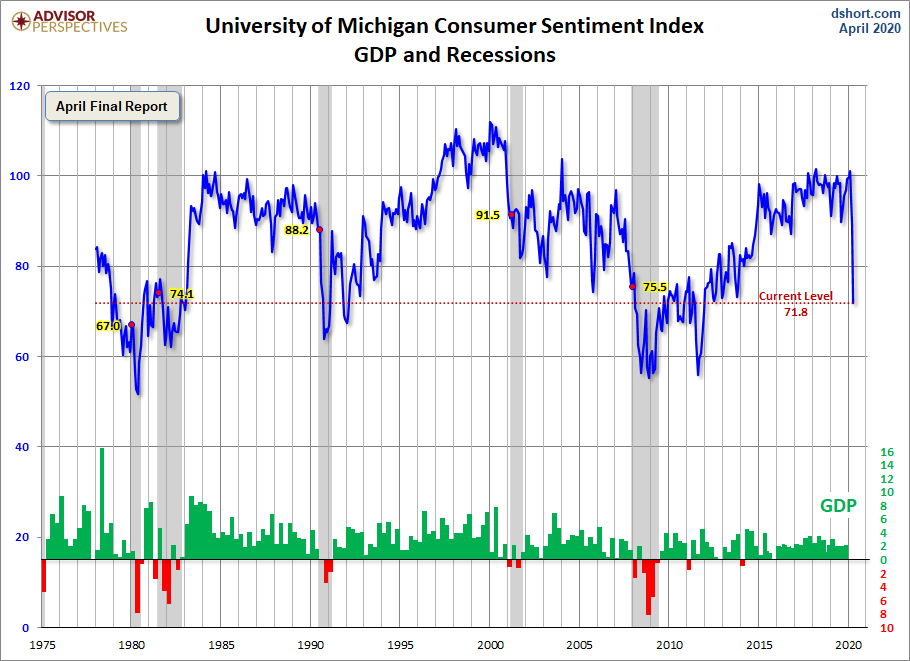
For an additional perspective on consumer attitudes, see the most recent Reuters/University of Michigan Consumer Sentiment Index. Here is the chart from that post.
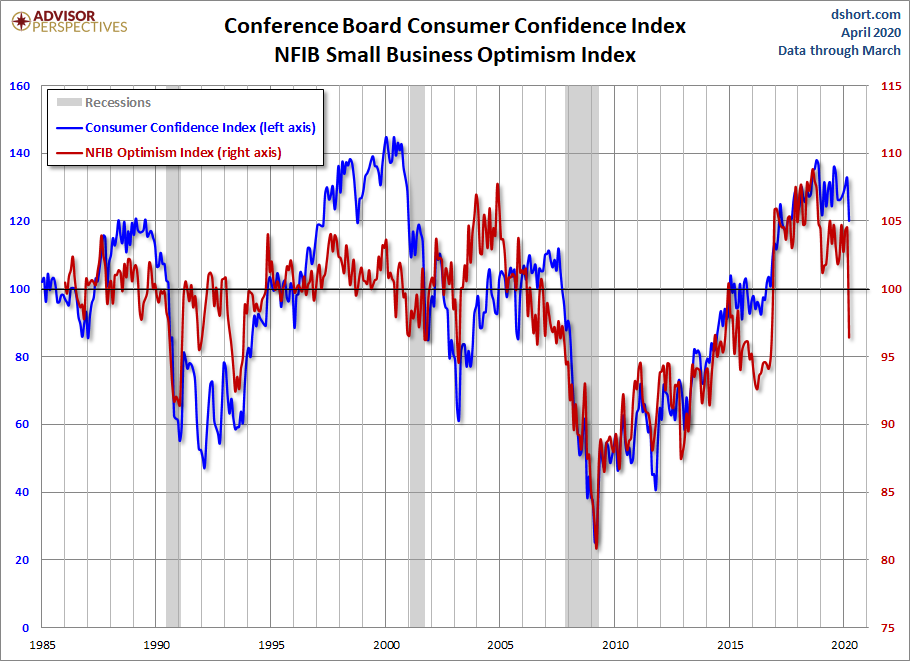
And finally, let's take a look at the correlation between consumer confidence and small business sentiment, the latter by way of the National Federation of Independent Business (NFIB) Small Business Optimism Index. As the chart illustrates, the two have tracked one another fairly closely since the onset of the Financial Crisis, although a spread appears infrequently, with the most recent spread showing up 2015 through present.



Comments
Log in or sign up to join the conversation.