
The headline number of 106.4 was a decrease of 2.2 from the final reading of 108.6 for April.
The Conference Board Consumer Confidence Index® decreased slightly in May, following a small increase in April. The Index now stands at 106.4 (1985=100), down from 108.6 in April (after an upward revision). The Present Situation Index—based on consumers’ assessment of current business and labor market conditions—declined to 149.6 from 152.9 last month. The Expectations Index—based on consumers’ short-term outlook for income, business, and labor market conditions—declined to 77.5 from 79.0.
“Consumer confidence dipped slightly in May, after rising modestly in April,” said Lynn Franco, Senior Director of Economic Indicators at The Conference Board. “The decline in the Present Situation Index was driven solely by a perceived softening in labor market conditions. By contrast, views of current business conditions—which tend to move ahead of trends in jobs—improved. Overall, the Present Situation Index remains at strong levels, suggesting growth did not contract further in Q2. That said, with the Expectations Index weakening further, consumers also do not foresee the economy picking up steam in the months ahead. They do expect labor market conditions to remain relatively strong, which should continue to support confidence in the short run.”
“Meanwhile, purchasing intentions for cars, homes, major appliances, and more all cooled—likely a reflection of rising interest rates and consumers pivoting from big-ticket items to spending on services. Vacation plans have also softened due to rising prices. Indeed, inflation remains top of mind for consumers, with their inflation expectations in May virtually unchanged from April’s elevated levels. Looking ahead, expect surging prices and additional interest rate hikes to pose continued downside risks to consumer spending this year.” Read more
Putting the Latest Number in Context
The chart below is another attempt to evaluate the historical context for this index as a coincident indicator of the economy. Toward this end, we have highlighted recessions and included GDP. The regression through the index data shows the long-term trend and highlights the extreme volatility of this indicator. Statisticians may assign little significance to a regression through this sort of data. But the slope resembles the regression trend for real GDP shown below, and it is a more revealing gauge of relative confidence than the 1985 level of 100 that the Conference Board cites as a point of reference.

For an additional perspective on consumer attitudes, see the most recent Reuters/University of Michigan Consumer Sentiment Index. Here is the chart from that post.

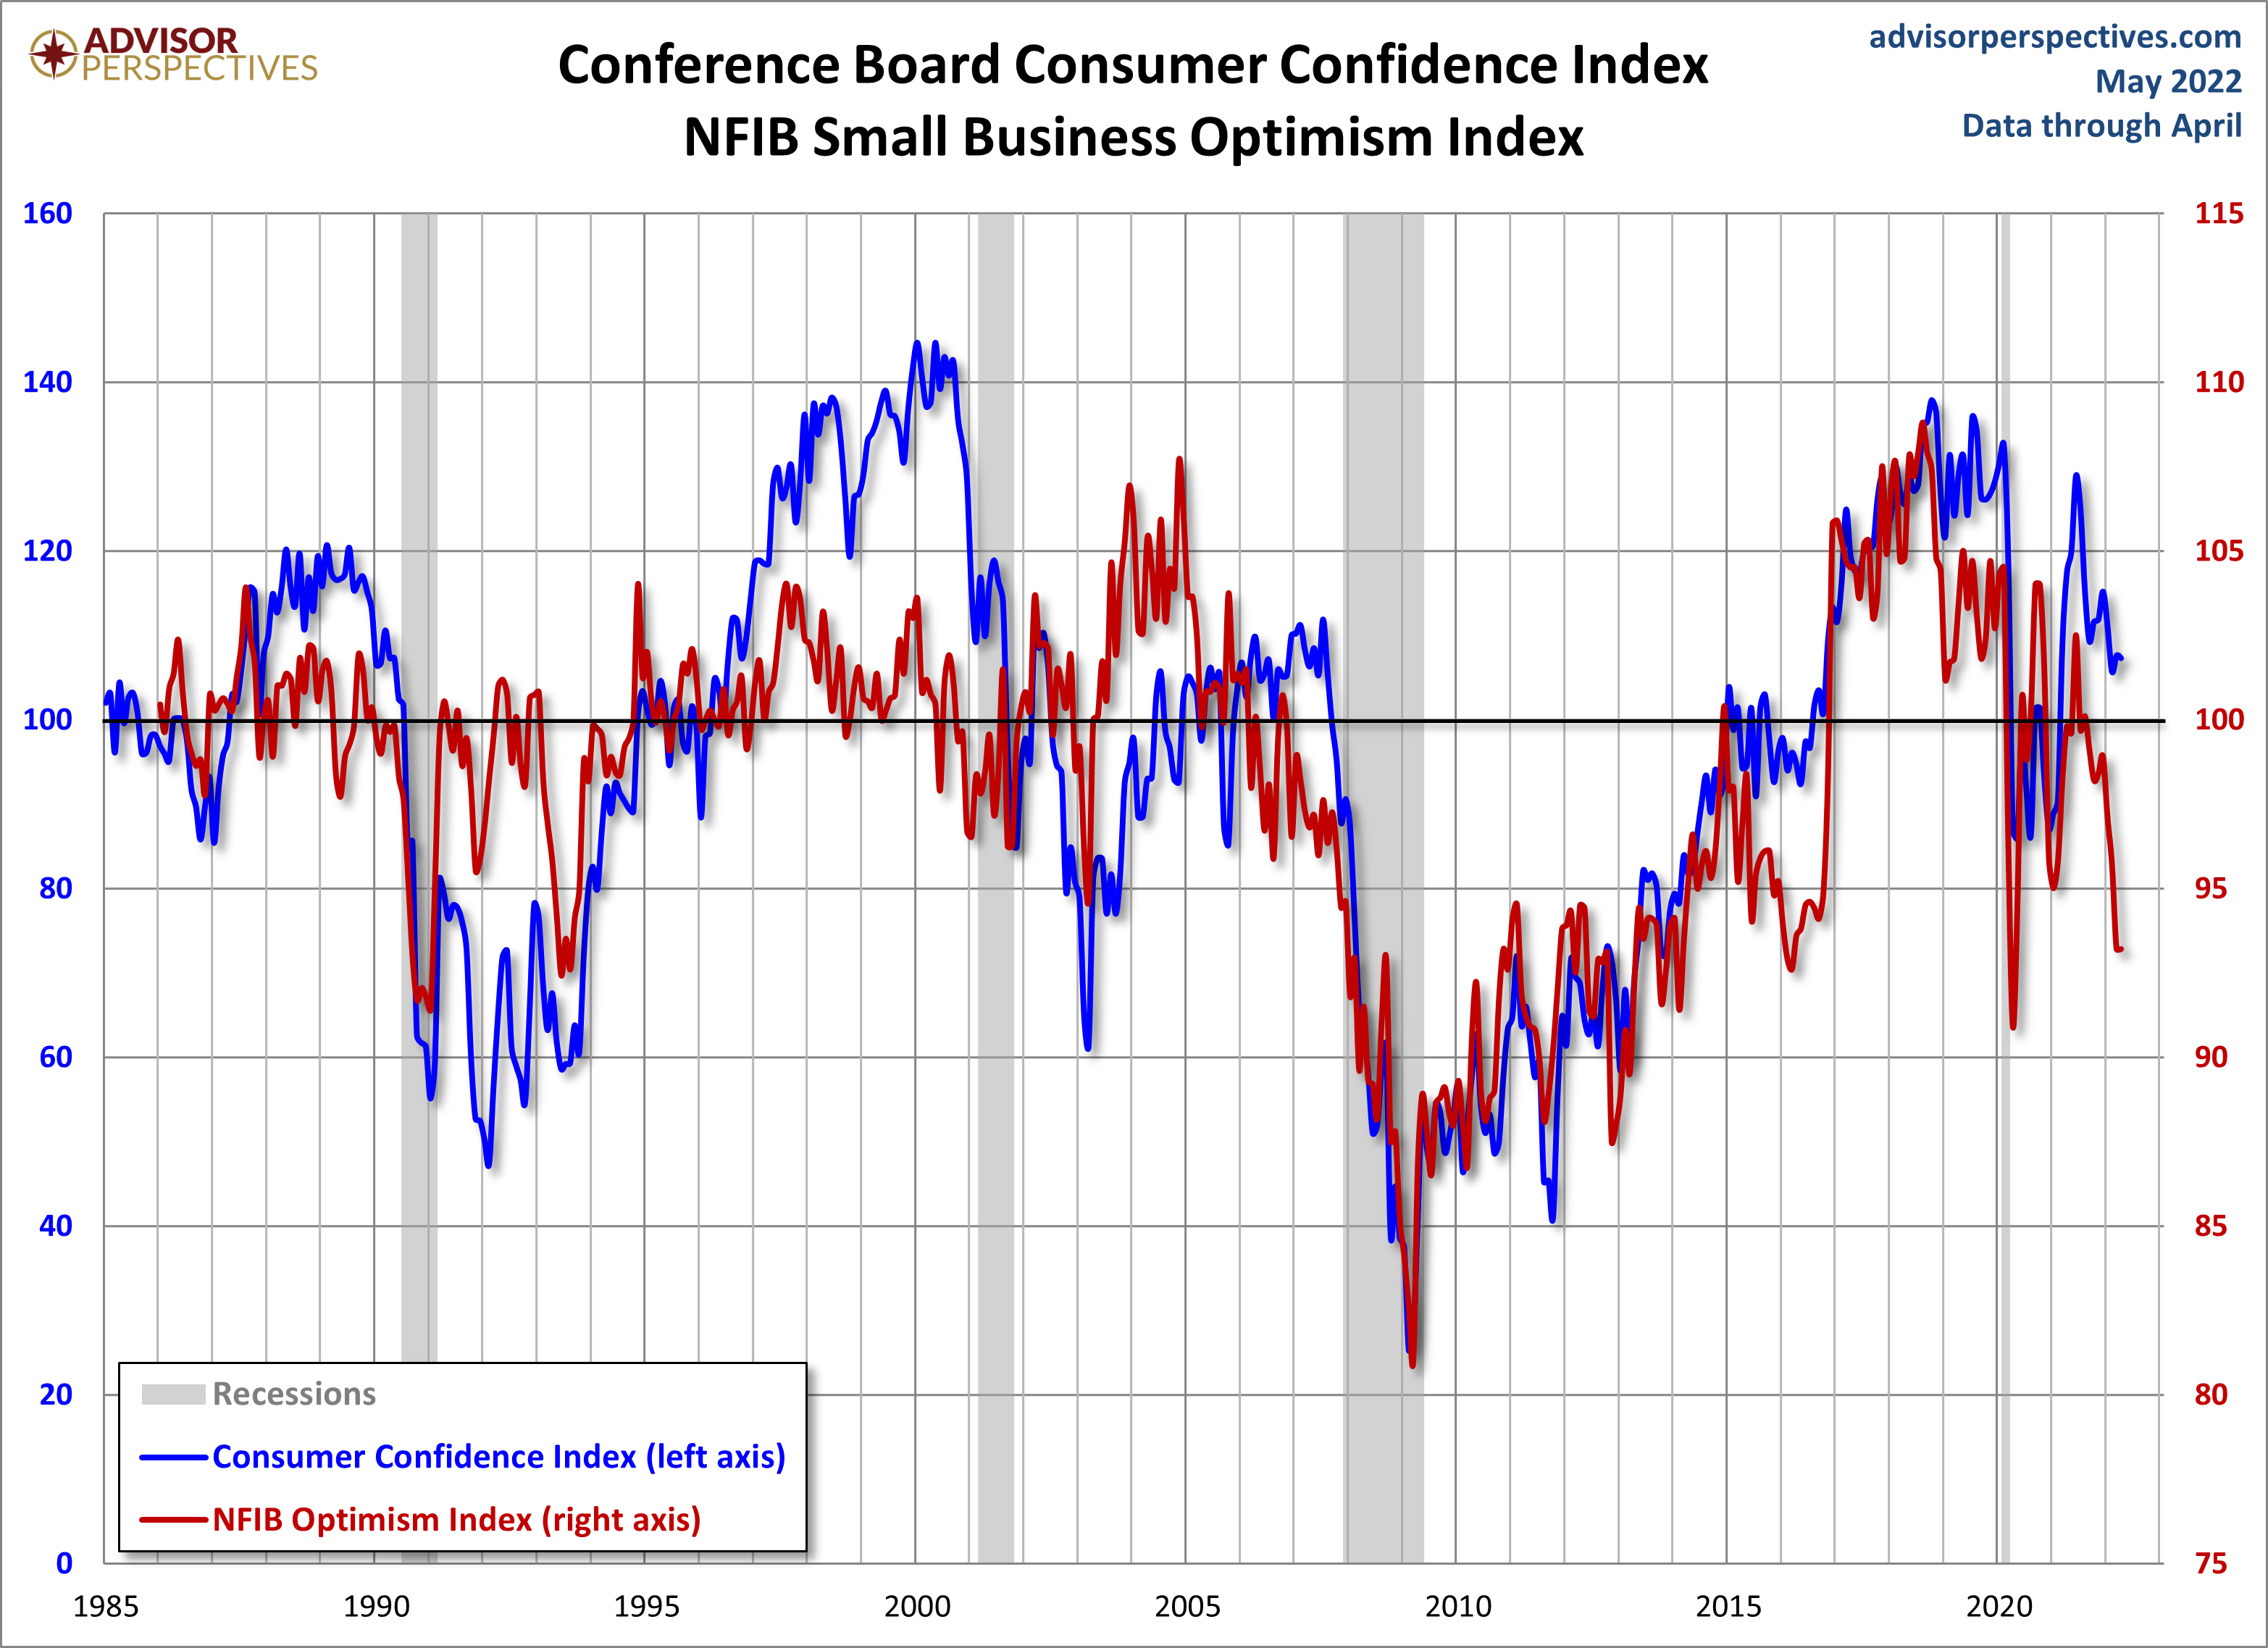
And finally, let's take a look at the correlation between consumer confidence and small business sentiment, the latter by way of the National Federation of Independent Business (NFIB) Small Business Optimism Index. As the chart illustrates, the two have tracked one another fairly closely since the onset of the Financial Crisis, although a spread appears infrequently, with the most recent spread showing up 2015 through present.


Comments
Log in or sign up to join the conversation.