

The latest Conference Board Leading Economic Index (LEI) for July was up 1.4% from the June final figure of 103.0. Investing.com predicted a 1.1% increase.
Here's an excerpt from the technical notes.
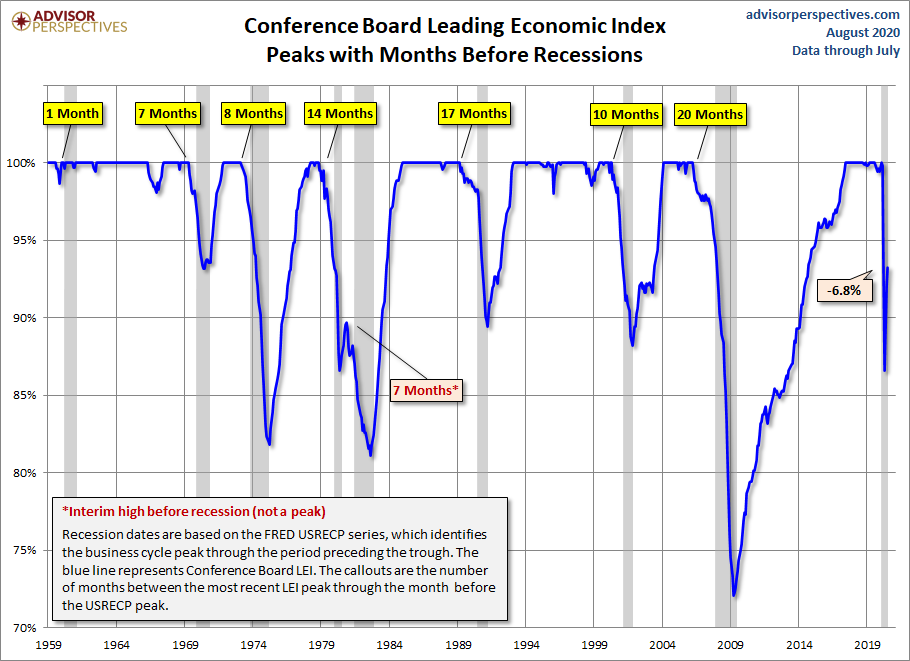
The Conference Board LEI for the U.S. increased for the third consecutive month in July. The largest positive contributions came from average weekly manufacturing hours, building permits, and initial claims for unemployment insurance (inverted). In the six-month period ending July 2020, the leading economic index decreased 6.8 percent (about a -13.1 percent annual rate), down from no growth over the previous six months. In addition, the weaknesses among the leading indicators have remained widespread.
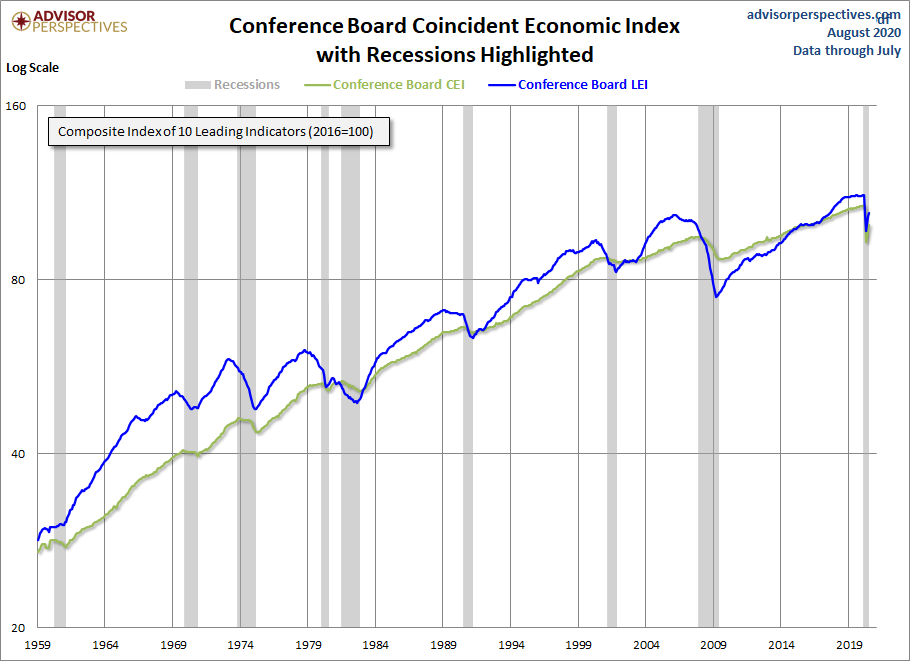
The Conference Board CEI for the U.S., a measure of current economic activity, also increased in July. However, the coincident economic index declined 7.6 percent (about a -14.7 percent annual rate) between January and July 2020, a reversal from the growth of 0.9 percent (about a 1.9 percent annual rate) for the previous six months. Also, the weaknesses among the coincident indicators have remained very widespread, with all components declining over the past six months. The lagging economicindex continued to decline, while the CEI is improving. As a result, the coincident-to-lagging ratio has been increasing. Real GDP contracted at a 32.9 percent annual rate in the second quarter, after declining 5.0 percent (annual rate) in the first quarter.
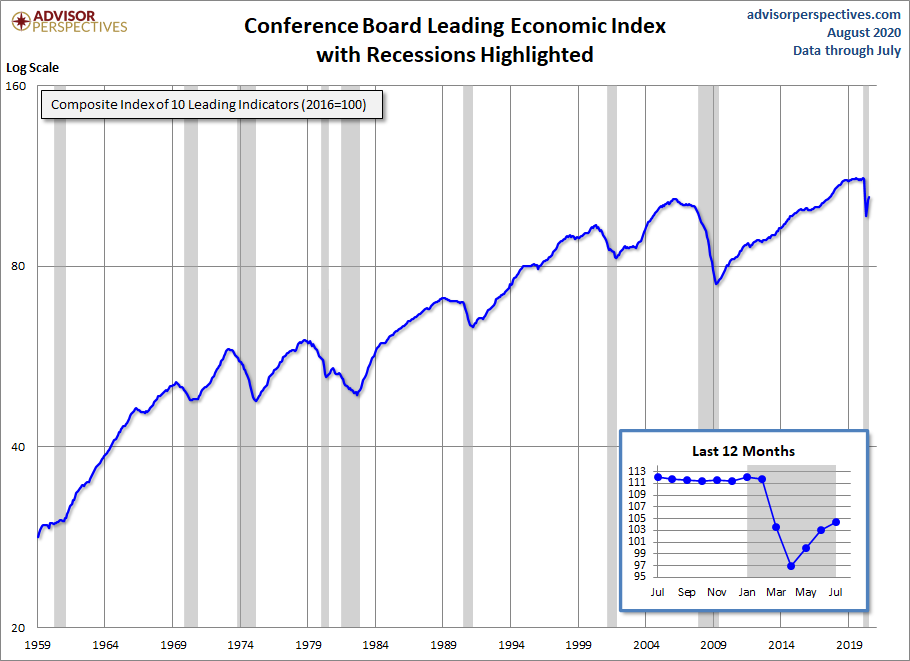
Here is a log-scale chart of the LEI series with documented recessions as identified by the NBER. The use of a log scale gives us a better sense of the relative sizes of peaks and troughs than a more conventional linear scale.
For additional perspective on this indicator, see the latest press release, which includes this overview:
NEW YORK, August 20, 2020…The Conference Board Leading Economic Index® (LEI) for the U.S. increased 1.4 percent in July to 104.4 (2016 = 100), following a 3.0 percent increase in June and a 3.1 percent increase in May.
“The US LEI increased for the third consecutive month in July, albeit at a slower pace than the sharp increases in the previous two months,” said Ataman Ozyildirim, Senior Director of Economic Research at The Conference Board. “Despite the recent gains in the LEI, which remain fairly broad-based, the initial post-pandemic recovery appears to be losing steam. The LEI suggests that the pace of economic growth will weaken substantially during the final months of 2020.”
For a better understanding of the relationship between the LEI and recessions, the next chart shows the percentage-off the previous peak for the index and the number of months between the previous peak and official recessions.
LEI and Its Six-Month Smoothed Rate of Change
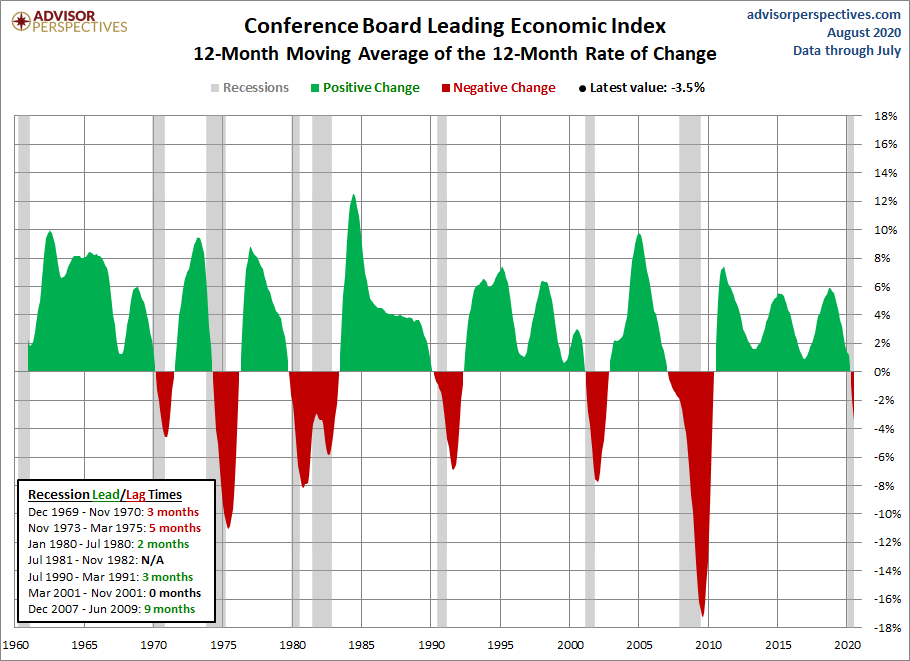
Based on suggestions from Neile Wolfe of Wells Fargo Advisors and Dwaine Van Vuuren of RecessionAlert, we can tighten the recession lead times for this indicator by plotting a smoothed six-month rate of change to further enhance our use of the Conference Board's LEI as a gauge of recession risk.

As we can see, the LEI has historically dropped below its six-month moving average anywhere between 2 to 15 months before a recession. Here is a twelve-month smoothed out version, which further eliminates the whipsaws:
The Conference Board also includes its Coincident Economic Index (CEI) in each release. It measures current economic activity and is made up of four components: nonagricultural payroll, personal income less transfer payments, manufacturing and trade sales, and industrial production. Based on observations, when the LEI begins to decline, the CEI is still rising. Here's a chart including both the CEI and LEI.
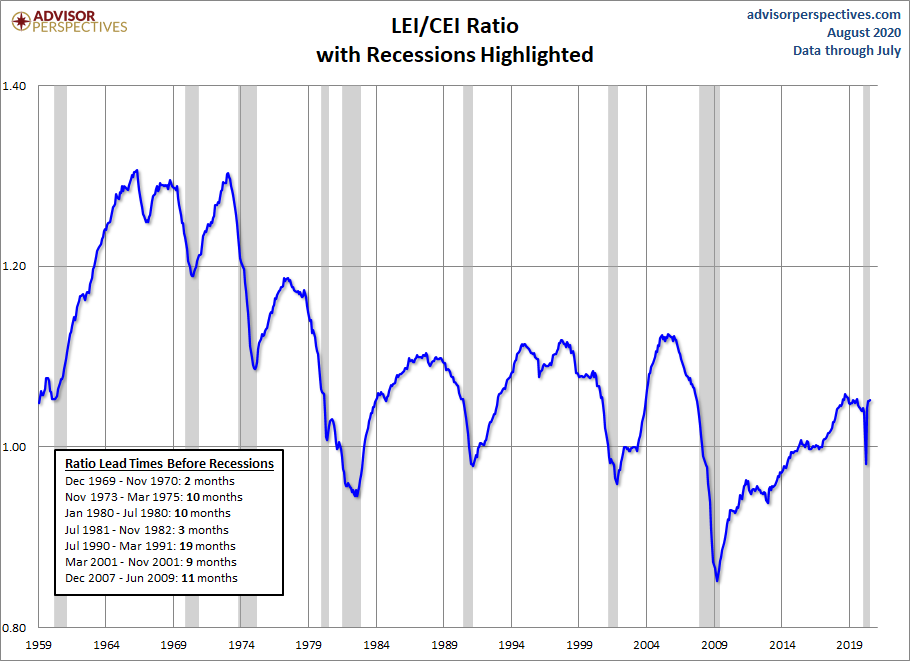
Here is a chart of the LEI/CEI ratio, which has also been a leading indicator of recessions.



Comments
Log in or sign up to join the conversation.