

(Click on image to enlarge)
Commodities such as Gold, Silver, Natural Gas, and Crude oil have been rallying since early August.
Though this overall asset class has been mixed (see the grains), it has been enough to produce a rally on the TR Equal Weight Commodity Index.
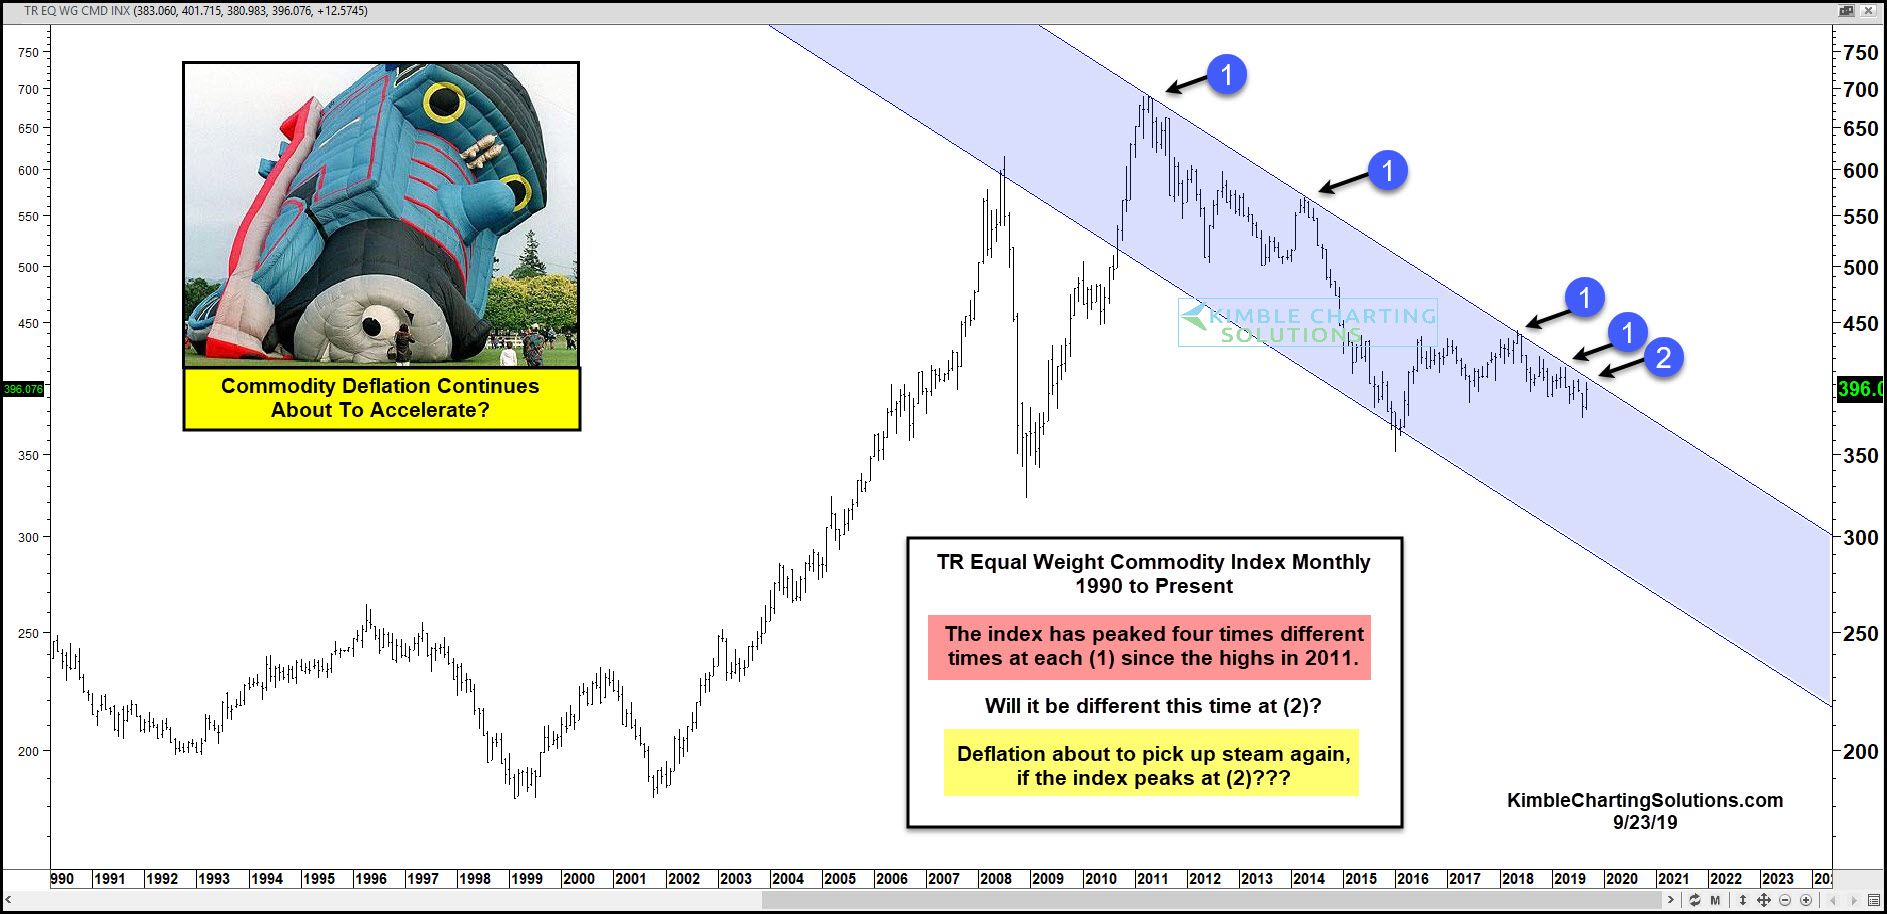
In today’s chart, we look at the big picture for commodities.
The chart below is a long-term “monthly” chart. As you can see, the commodity index has been in a multi-year downtrend with each rally being rejected at downtrend resistance (1).
The latest rally has the index testing this downtrend line once again.
Are commodities about to create another lower peak at (2)?
Or will it be different this time?



Comments
Log in or sign up to join the conversation.