

Commodities posted the strongest gain for the major asset classes last week, based on a set of exchange-traded funds. Equities generally were also in positive terrain for the trading week through Friday, Oct. 25.
The iShares S&P GSCI Commodity-Indexed Trust (GSG) led the field with a strong 2.4% gain last week, lifting the fund to its highest close in a month.
Equities around the world also posted gains for the week, topped by emerging markets stocks. Vanguard FTSE Emerging Markets (VWO) rose 1.3%, marking the fourth consecutive weekly gain for the ETF. The latest rally lifted VWO to a three-month high.
Last week’s biggest loser: foreign government bonds. SPDR Bloomberg Barclays International Treasury Bond (BWX) has been trading in a tight range recently but the bears took control on Friday, cutting the ETF to the lowest price for the week.
The upside bias in markets last week lifted an ETF-based version of the Global Market Index (GMI.F). This unmanaged benchmark, which holds all the major asset classes (except cash) in market-value weights, gained 0.7% – the index’s third straight weekly advance.

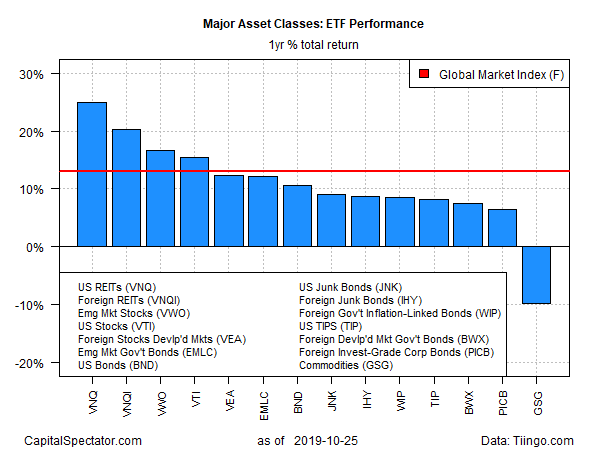
For the one-year trend, US real estate investment trusts (REITs) continue to lead, although the sector’s performance edge faded a bit last week. Nonetheless, Vanguard Real Estate (VNQ) remains comfortably in first place over the rest of the major asset classes with a 23.4% total return for the trailing 12-month period.
The second-strongest one-year performance is foreign real estate/REITs. Vanguard Global ex-US Real Estate (VNQI) is ahead by 17.1% for the trailing 252-trading-day period through last week’s close.
Commodities remain the weakest one-year performer. GSG has lost 9.9% over the past year.
The recent tailwind in several key markets has lifted GMI.F for the trailing one-year period. The benchmark is now up a sizzling 12.9% over the past year.
Profiling all the ETFs listed above through a momentum lens shows that a strong upside bias prevails. The analysis is based on two sets of moving averages. The first compares the 10-day moving average with its 100-day counterpart — a proxy for short-term trending behavior (red line in chart below). A second set of moving averages (50 and 200 days) represent the intermediate measure of the trend (blue line). As of last week’s close, a bullish tailwind has been priced into nearly every component of the major asset classes.



Comments
Log in or sign up to join the conversation.