

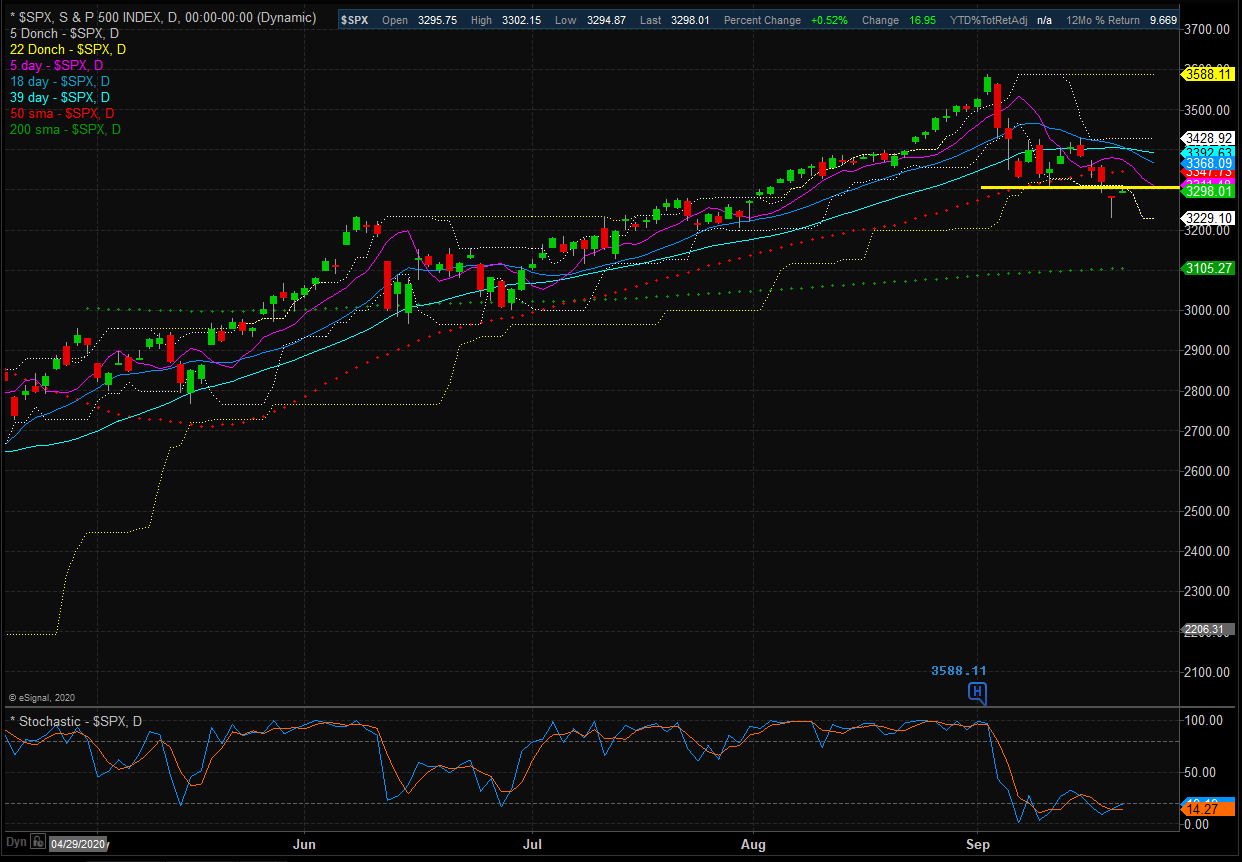
In last week's technical review, I opined that (a) there were clear lines in the sand on the charts of the major indices, (b) any movement in between those lines could be viewed as "noise," and (c) a break above or below the key support/resistance was the key to the next move. Fast forward three sessions and suddenly the Dow and S&P 500 finds themselves below those respective support zones. Worries over a prolonged economic slog, alarming increases in COVID cases, and the real possibility that the next round of stimulus (something that the Fed has stated it would like to see) may be derailed over the politics of RGB's replacement on SCOTUS have combined to provide the bears with the impetus to color outside the lines. From a technical perspective, this suggests that some additional downside price exploration may be in order. However, if the bulls can find a way to push back on the narrative that the economic recovery is in jeopardy, then buyers may find current levels in some of the big names appealing. As such, the action over the next couple of days looks to be important.
The State of the Trend Indicators
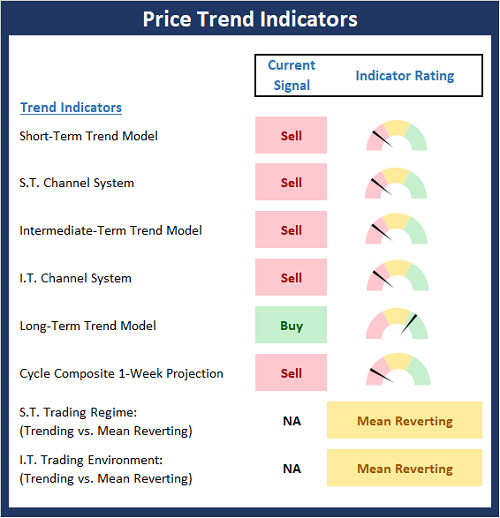
As you might expect, the Trend Board has taken a hit over the past week. This suggests to me that the corrective/consolidation phase remains intact and that buyers may want to exercise some caution for a while.
* Source: Ned Davis Research (NDR) as of the date of publication. Historical returns are hypothetical average annual performances calculated by NDR. Past performances do not guarantee future results or profitability - NOT INDIVIDUAL INVESTMENT ADVICE.
About The Trend Board Indicators: The models/indicators on the Trend Board are designed to determine the overall technical health of the current stock market trend in terms of the short- and intermediate-term time frames.
My Take on the State of the Charts...
With the "test" of the recent support zones looking like it failed, one can argue that the S&P 500 has now embarked on a downtrend. From here, I see two possible outcomes. First, the bears become emboldened given the potential for delayed/derailed economic recovery. If this occurs, we will want to watch to see if the indices can put in a "lower low" on a closing chart. Second, the "COVID Winners" trade resumes, supporting the S&P and NASDAQ indices in the process. I figure this would push the major indices back into a trading range until the skies clear. So, as I mentioned above, my feeling is the next few days may provide a decent tell as to what we should expect next.
S&P 500 - Daily
(Click on image to enlarge)
Next, let's check in on the state of the market's internal momentum indicators.
* Source: Ned Davis Research (NDR) as of the date of publication. Historical returns are hypothetical average annual performances calculated by NDR. Past performances do not guarantee future results or profitability - NOT INDIVIDUAL INVESTMENT ADVICE.
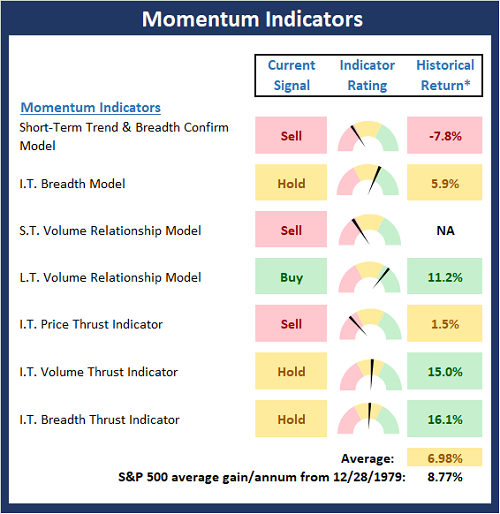
Like the Trend board, the Momentum board saw some meaningful deterioration over the past week. The good news is the intermediate-term indicators/models are not negative and some of the models that moved into the red did so only marginally. This tells me that so far at least, we are dealing with a correction/pullback/consolidation, and not the beginning of a cyclical bear.
The Bottom Line
From my perch, I continue to see the current action as a corrective move that is effectively "working off" some of the excesses that had built up during July/August. Remember, some of these moves (think TSLA) were, in my words, "ridiculous". As such, a period of consolidation/digestion certainly makes sense. However, we do need to stay alert for the possibility that something in the overall narrative (i.e. trader assumptions) has changed. Stay tuned!



Comments
Log in or sign up to join the conversation.