

Citigroup Inc. (C) is a global financial services company. It provides consumers, corporations, governments and institutions with a broad range of financial products and services, including consumer banking and credit, corporate and investment banking, securities brokerage, transaction services and wealth management. The Company also offers various wholesale banking products and services, including fixed income and equity sales and trading, foreign exchange, prime brokerage, and equity and fixed income research services. Citigroup Inc. is based in New York.
It's been quite a ride for the "big" C--Citigroup, one of the more infamous banks of the Bush The Younger-era Great Recession. The bank was in tatters after the housing-bubble blow up, and was a major recipient of bailout monies. Now, however, some analysts find that it is a good time to buy the shares.
The company has done a great job managing their recovery, and now the stock is trading at a discount compared to peers. The giant bank has a low P/E, a much stronger balance sheet, and they enjoy a big advantage thanks to their heavy losses from a few years ago.
Now that the company has recovered and good times are back, they can reap significant tax advantages thanks to their use of various write-offs accrued during the times of big losses. These deferred tax assets (DTAs), are estimated to total up to $30 billion by some analysts.
That's a lot of cushion against taxes on profits moving forward. Higher profits thanks to the recovery, tax savings, and other factors should lead to strong dividends for shareholders. And if the firm uses some of that excess to bolster the share price via a buyback program, the benefits could be even more significant for those who bought the stock at a decent valuation.
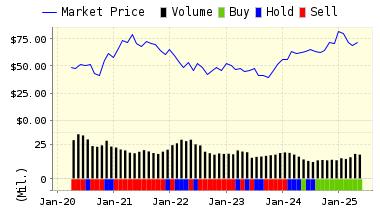
We continues with a BUY recommendation on CITIGROUP INC for 2016-03-14. Based on the information we have gathered and our resulting research, we feel that CITIGROUP INC has the probability to OUTPERFORM average market performance for the next year. The company exhibits ATTRACTIVE Company Size and P/E Ratio.
|
ValuEngine Forecast |
||
|
Target |
Expected |
|
|---|---|---|
|
1-Month |
42.86 | 0.44% |
|
3-Month |
43.13 | 1.09% |
|
6-Month |
43.41 | 1.73% |
|
1-Year |
44.95 | 5.34% |
|
2-Year |
42.70 | 0.06% |
|
3-Year |
41.71 | -2.25% |
|
Valuation & Rankings |
|||
|
Valuation |
18.14% undervalued |
Valuation Rank |
 72 72 |
|
1-M Forecast Return |
0.44% |
1-M Forecast Return Rank |
82 |
|
12-M Return |
-20.30% |
Momentum Rank |
37 |
|
Sharpe Ratio |
-0.12 |
Sharpe Ratio Rank |
53 |
|
5-Y Avg Annual Return |
-3.72% |
5-Y Avg Annual Rtn Rank |
52 |
|
Volatility |
31.78% |
Volatility Rank |
55 |
|
Expected EPS Growth |
1.29% |
EPS Growth Rank |
27 |
|
Market Cap (billions) |
129.27 |
Size Rank |
100 |
|
Trailing P/E Ratio |
8.23 |
Trailing P/E Rank |
93 |
|
Forward P/E Ratio |
8.12 |
Forward P/E Ratio Rank |
87 |
|
PEG Ratio |
6.40 |
PEG Ratio Rank |
5 |
|
Price/Sales |
1.46 |
Price/Sales Rank |
52 |
|
Market/Book |
0.66 |
Market/Book Rank |
85 |
|
Beta |
2.10 |
Beta Rank |
10 |
|
Alpha |
-0.12 |
Alpha Rank |
40 |
Market Overview
|
Summary of VE Stock Universe |
|
|
Stocks Undervalued |
59.84% |
|
Stocks Overvalued |
40.16% |
|
Stocks Undervalued by 20% |
26.18% |
|
Stocks Overvalued by 20% |
12.14% |
Sector Overview
|
Sector |
Change |
MTD |
YTD |
Valuation |
Last 12-MReturn |
P/E Ratio |
|
Utilities |
-0.38% |
3.66% |
4.27% |
8.33% overvalued |
-1.20% |
23.37 |
|
Consumer Staples |
-0.00% |
3.96% |
2.29% |
7.58% overvalued |
0.81% |
24.01 |
|
Basic Materials |
-0.23% |
10.13% |
13.08% |
3.39% overvalued |
-6.59% |
25.86 |
|
Multi-Sector Conglomerates |
0.01% |
7.01% |
0.91% |
0.58% overvalued |
-14.45% |
19.21 |
|
Industrial Products |
0.22% |
7.09% |
1.90% |
0.16% overvalued |
-12.17% |
17.70 |
|
Computer and Technology |
-0.12% |
4.27% |
2.38% |
2.88% undervalued |
-9.85% |
26.45 |
|
Business Services |
-0.08% |
3.66% |
-2.14% |
4.02% undervalued |
-11.39% |
21.47 |
|
Aerospace |
-0.46% |
3.16% |
-4.49% |
4.37% undervalued |
-15.84% |
18.23 |
|
Consumer Discretionary |
0.11% |
5.18% |
0.74% |
4.88% undervalued |
-8.81% |
24.11 |
|
Finance |
-0.26% |
4.79% |
-3.00% |
4.97% undervalued |
-6.97% |
15.39 |
|
Retail-Wholesale |
-0.69% |
3.83% |
0.01% |
6.41% undervalued |
-11.76% |
22.50 |
|
Oils-Energy |
-1.15% |
13.58% |
3.64% |
8.48% undervalued |
-34.08% |
21.75 |
|
Construction |
-0.28% |
5.36% |
-0.27% |
9.64% undervalued |
-6.54% |
19.30 |
|
Auto-Tires-Trucks |
0.20% |
9.98% |
-1.37% |
10.15% undervalued |
-17.50% |
12.22 |
|
Transportation |
-0.34% |
5.91% |
-0.36% |
11.86% undervalued |
-22.41% |
12.97 |
|
Medical |
0.41% |
5.19% |
-9.38% |
12.08% undervalued |
-23.04% |
25.89 |
Valuation Watch: Overvalued stocks now make up 40.16% of our stocks assigned a valuation and 12.14% of those equities are calculated to be overvalued by 20% or more. Five sectors are calculated to be overvalued.
Comments
Log in or sign up to join the conversation.