This chart shows the official deficits (red columns) and the increase in outstanding debt (blue columns) each year:
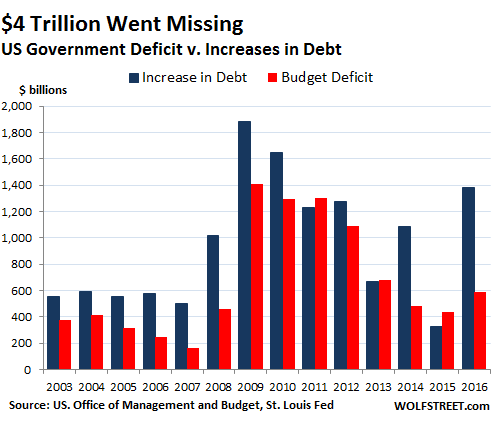
http://wolfstreet.com/2016/10/01/why-u-s-government-deficit-numbers-are-a-big-lie-national-debt/

The $4 trillion was borrowed and the bonds were issued and the amounts are still outstanding, but the proceeds from the bond sales went out the door, off the books!
This chart shows the official deficits (red columns) and the increase in outstanding debt (blue columns) each year:
http://wolfstreet.com/2016/10/01/why-u-s-government-deficit-numbers-are-a-big-lie-national-debt/
None.


Comments
Log in or sign up to join the conversation.