

The S&P Dow Jones Indices announced yesterday, after the market closed, a notable restructuring of the Dow Jones Industrial Average (DJIA) index that will be effective before the opening of the session on Monday, August 31.
From that moment on, the following companies will be included in the composition of the index:
- Salesforce.com
- Amgen
- Honeywell International
These shares will replace the following:
- Exxon Mobil
- Pfizer
- Raytheon Technologies
This is the third time this century that the Dow Jones has transformed by suddenly switching to three of its components.
The first occasion was in 2004, when Pfizer, Verizon and American International Group entered. The second was in 2013, with the inclusion of Goldman Sachs, Visa and Nike in the index.
This time, as explained by the S&P Dow Jones Indices in a press release, the renewal is a consequence of the announcement of Apple's share split in a ratio of 4 to 1 after the market close next Friday.
This adjustment will have several key affects:
- A reduction in the weight of the technology sector in the index
- Apple will fall from the first position to the middle of the table of components of the Dow Jones.
- The renewal of the components of the index "will help offset this reduction," according to the index manager in the statement.
- It will also "help diversify the index, eliminating the overlap between similar companies and adding other types of business to better reflect the American economy."
In the following table you can see the changes at a glance:

Source: S&P Dow Jones Indices
Let's see how the DJIA has evolved in the last year:
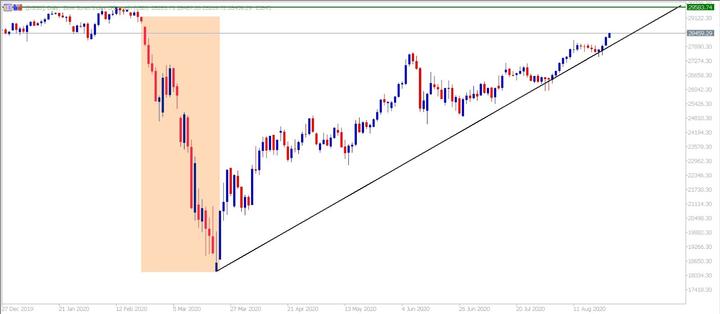
Source: Admiral Markets MetaTrader 5 Supreme Edition. DJI30 daily chart. Data range: from December 27, 2019 to August 25, 2020. Prepared on August 25, 2020 at 9 am. - Keep in mind that past returns do not guarantee future returns.
As we see in the graph, the Dow Jones has recovered almost everything it lost after the collapse of the markets due to the coronavirus crisis (highlighted by the pink rectangle). The trend is clearly upward since the index registered its annual minimum on March 23 at 18,207 points and is already close to the historical maximum that it reached in February 2020 at 29,583 points. We will have to wait and see how the market reacts to the changes announced when Wall Street opens the session today.



Comments
Log in or sign up to join the conversation.