
Chainlink(LINKUSD)
LINKUSD Elliott Wave Technical Analysis
Function: Follow trend
Mode: Motive
Structure: Impulse
Position: Wave (3)
Direction Next higher Degrees: Wave V of Motive
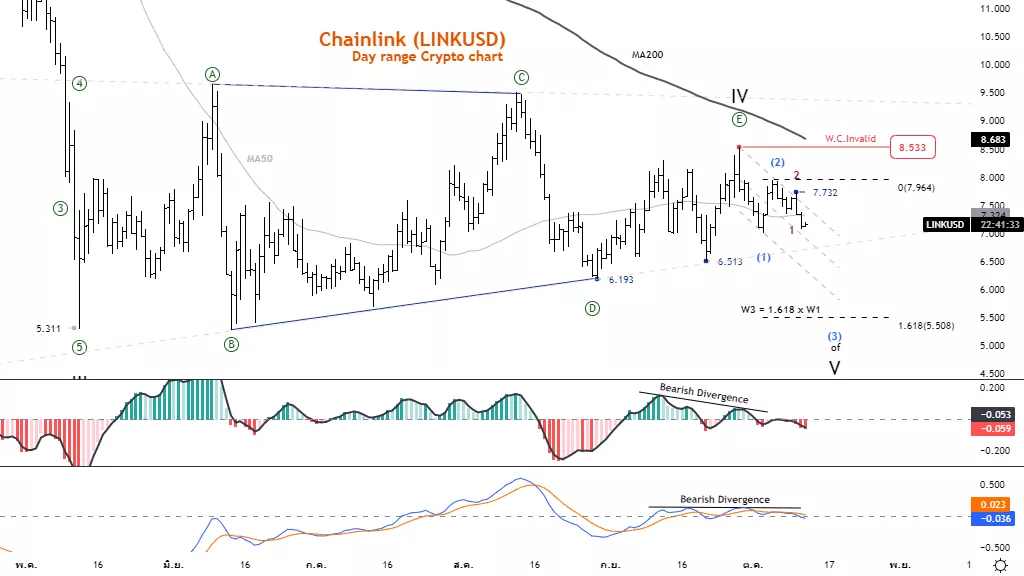
Details: The price is still on a short-term downtrend. There is an opportunity to trade
below 5.311 but must not pullback above 8.533
Wave Cancel invalid Level: 8.533
Chainlink(LINKUSD)Trading Strategy: The decline of Wave (3) is likely to be 1.618 x Wave
(1) at the 5.508 level. This could be a short-term opportunity to open a short position.
However, the price must not pull back above 7.732.
Chainlink(LINKUSD)Technical Indicators: The price is below the MA50O and MA200 lines,
MACD and MACD Histogram have bearish Divergence the trend is bearish.
(Click on image to enlarge)
Chainlink(LINKUSD)
LINKUSD Elliott Wave Technical Analysis
Function: Follow trend
Mode: Motive
Structure: Impulse
Position: Wave (3)
Direction Next higher Degrees: Wave V of Motive
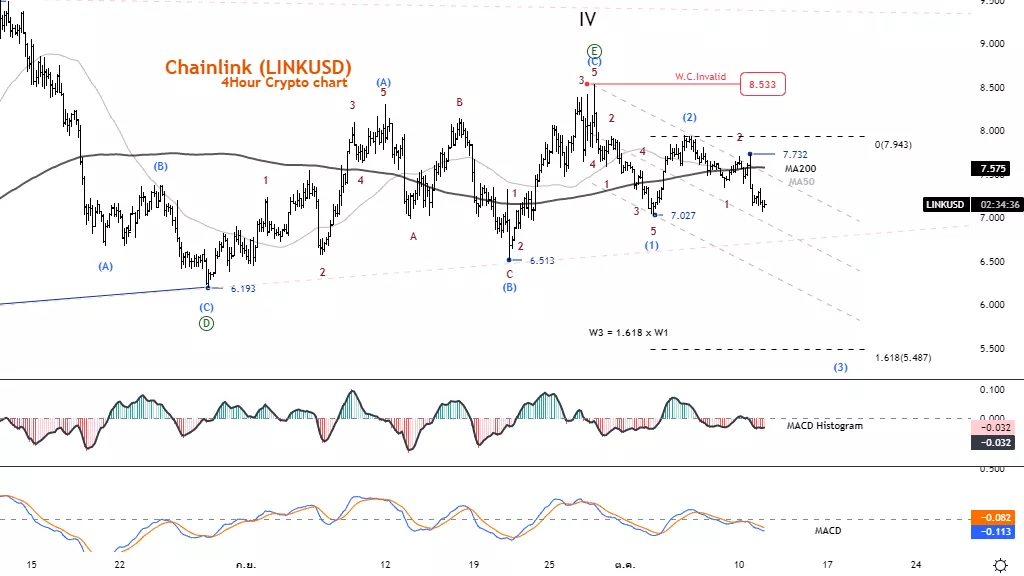
Details: The price is still on a short-term downtrend. There is an opportunity to trade
below 5.311 but must not pullback above 8.533
Wave Cancel invalid Level: 8.533
Chainlink(LINKUSD)Trading Strategy: The decline of Wave (3) is likely to be 1.618 x Wave
(1) at the 5.508 level. This could be a short-term opportunity to open a short position.
However, the price must not pull back above 7.732.
Chainlink(LINKUSD)Technical Indicators: The price is below the MA50O and MA200 lines,
MACD is below the Zero line, and the trend is bearish.
(Click on image to enlarge)
More By This Author:
SP500 Elliott Wave Analysis Wave Ii) For Short Trades
Bitcoin Elliott Wave: A Rally, Then Down Into Wave Iii
SP500, AAPL, AMZN, NVDA, TSLA, GOOGL, BRK.B, SQ, META, NFLX,ENPH, MSFT, GS, JPM, BAC. Elliott Wave


Comments
Log in or sign up to join the conversation.