

(Well, actually, the recession had been underway for nearly ten months, and after Lehman Brothers, on October 26th, 2008). Or why I worry about the White House economic policy management team.
NO DEPRESSION; NO SEVERE RECESSION
The medium term fundamentals point toward more real GDP, more employment, and (to a lesser degree) more consumption. Some employment and real GDP declines may occur in the short run, but they will be small by historical standards. Professor Cooley recently explained “The losses to date represent less than .5% of the work force. In the relatively mild recession of 2001 to 2002, job losses equaled about 1% of the work force. In the much more severe recession of 1981 to 1982, job losses totaled nearly 3% of the labor force–six times today’s figure. And in the (truly) Great Depression–invoked, now, with an alarmist frequency–job losses between 1929 and the trough in 1933 were 21% of the labor force.” Note that 21% over 3 1/2 years is an average decline of 2% every quarter for 14 consecutive quarters! If employment declines 2% in even one quarter, or 5% over a full year, I will admit well before 2010 that a severe recession is happening and that my 2010 forecasts are unlikely to be attained.
According to the BLS, national nonfarm employment was 136,783,000 (SA) at the end of 2006, as the housing price crash was getting underway. Real GDP was $11.4 trillion (chained 2000 $). Barring a nuclear war or other violent national disaster, employment will not drop below 134,000,000 and real GDP will not drop below $11 trillion. The many economists who predict a severe recession clearly disagree with me, because 134 million is only 2.4% below September’s employment and only 2.0% below employment during the housing crash. Time will tell.
More on Dr. Mulligan’s analyses here: [1] [2] [3] [4] [5] [6] [7] [8]
Here’s what the most recent vintages of the data say about Dr. Mulligan’s forecasts (recalling that ARRA was passed in February 2009). (A discussion of using the data available to Dr. Mulligan at the time of his forecast, see this post.)
(Click on image to enlarge)
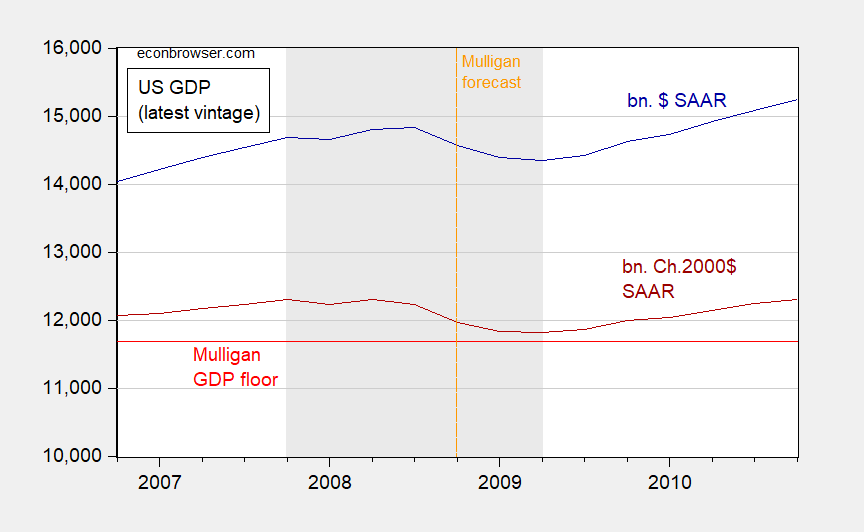
Figure 1: GDP in billions of $ (blue), and in billions Ch.2000$ (dark red), SAAR. GDP calculated using GDP deflator adjusted to 2000=1. Mulligan GDP floor in bn. Ch.2000$ SAAR, calculated by subtracting 0.4 trn from 2006Q4 real GDP. NBER defined recession dates shaded gray. Source: BEA, 2019Q1 second release, NBER, and author’s calculations.
Notice that realized GDP in 2009Q2 was only 0.55% above the Mulligan floor. Since CBO low/high estimates of the impact of the ARRA — passed in 2009Q1 — was 1.2% to 2.4%, this means that Mulligan’s floor would’ve been breached in the absence of the ARRA. (If you are wondering about the calculations, the midpoint is 1.8% impact, sow 0.982 of realized 2009Q2 GDP expressed in 2000$ is 11603, while 0.4 trn below 2006Q4 levels is 11668.)
What about employment? Well, even with the ARRA, we blew way past the Mulligan floor of 134 million. This is shown in Figure 2.
(Click on image to enlarge)
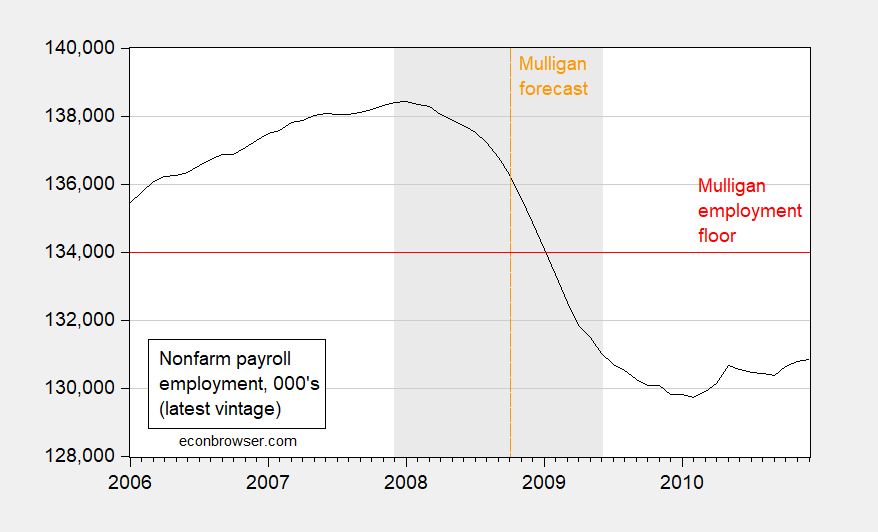
Figure 2: Nonfarm payroll employment in thousands, s.a., (black). NBER recession dates shaded gray. Source: BLS, May release, and NBER.
Let me observe, once again, that we breached Mulligan’s floor even before the passage of the ARRA. So if we believe — as Mulligan did, and apparently still does, — that the ARRA increased wedges thereby worsening the recession, he missed (since to my knowledge, no nuclear war occurred).
So, now that I’m pretty sure a slowdown is coming, and a recession highly likely, I’m ever more worried about the economic crisis management team at the White House. I hope I will be proved wrong.
Interesting fact: Mulligan wrote his October 2008 post after Don Luskin wrote his September column, thereby showing that an actual advanced degree is no protection against complacency.


Comments
Log in or sign up to join the conversation.