

The non-seasonally adjusted Case-Shiller home price index (20 cities) year-over-year rate of home price growth grew from a downwardly revised 5.8 % to 6.2%. The index authors stated, "Most economic indicators suggest that home prices can see further gains."

Analyst Opinion of Case-Shiller HPI
Many pundits believe home prices are back in a bubble. Maybe, but the falling inventory of homes for sale keeps home prices relatively high. I continue to see this a situation of supply and demand. It is the affordability of the homes which is becoming an issue for the lower segments of consumers. This is the highest year-over-year growth since July 2014.
- 20 city unadjusted home price rate of growth grew 0.4 % month-over-month. [Econintersect uses the change in year-over-year growth from month-to-month to calculate the change in rate of growth]
- Note that Case-Shiller index is an average of the last three months of data.
- The market expected:
| Consensus Range | Consensus | Actual | |
| 20-city, SA - M/M | 0.3 % to 0.5 % | 0.4 % | +0.5 % |
| 20-city, NSA - M/M | 0.4 % to 0.5 % | 0.4 % | +0.4 % |
| 20-city, NSA - Yr/Yr | 6.0 % to 6.3 % | 6.2 % | +6.2 % |
S&P/Case-Shiller Home Price Indices Year-over-Year Change
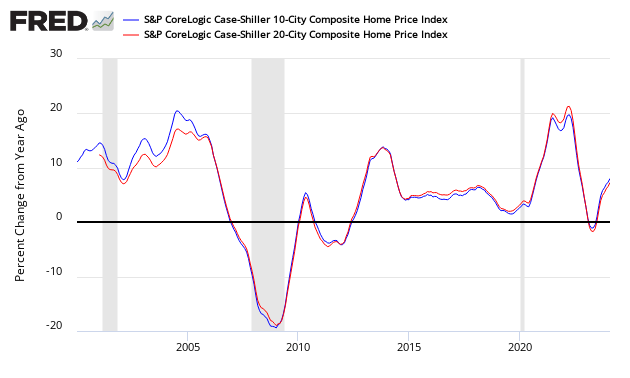
Comparing all the home price indices, it needs to be understood each of the indices uses a unique methodology in compiling their index - and no index is perfect.

The way to understand the dynamics of home prices is to watch the direction of the rate of change. Here home price growth generally appears to stabilize (rate of growth not rising or falling).

There are some differences between the indices on the rate of "recovery" of home prices.
A synopsis of Authors of the Leading Indices:
Case Shiller's David M. Blitzer, Chairman of the Index Committee at S&P Indices:
Home prices continued to rise across the country with the S&P CoreLogic Case-Shiller National Index rising at the fastest annual rate since June 2014. Home prices were higher in all 20 cities tracked by these indices compared to a year earlier; 16 cities saw annual price increases accelerate from last month. Strength continues to be concentrated in the west with Seattle, Las Vegas, San Diego and Portland seeing the largest gains. The smallest increases were in Atlanta, New York, Miami, Chicago and Washington. Eight cities have surpassed their pre-financial crisis peaks.
Most economic indicators suggest that home prices can see further gains. Rental rates and home prices are climbing, the rent-to-buy ratio remains stable, the average rate on a 30-year mortgage is still under 4%, and at a 3.8-month supply, the inventory of homes for sale is still low. The overall economy is growing with the unemployment rate at 4.1%, inflation at 2% and wages rising at 3% or more. One dark cloud for housing is affordability - rising prices mean that some people will be squeezed out of the market.
CoreLogic believes low inventories are spurring rising home prices (September 2017 Data). Per Dr. Frank Nothaft, chief economist for CoreLogic and Frank Martell, president and CEO of CoreLogic stated:
Heading into the fall, home price growth continues to grow at a brisk pace. This appreciation reflects the low for-sale inventory that is holding back sales and pushing up prices. The CoreLogic Single-Family Rent Index rose about 3 percent over the last year, less than half the rise in the national Home Price Index.
A strengthening economy, healthy consumer balance sheets and low mortgage interest rates are supporting the continued strong demand for residential real estate. While demand and home price growth is in a sweet spot, a third of metropolitan markets are overvalued and this will become more of an issue if prices continue to rise next year as we anticipate.
The National Association of Realtors says home sales prices continue to increase (October 2017 data):
Lawrence Yun, NAR chief economist, says sales activity in October picked up for the second straight month, with increases in all four major regions. "Job growth in most of the country continues to carry on at a robust level and is starting to slowly push up wages, which is in turn giving households added assurance that now is a good time to buy a home," he said. "While the housing market gained a little more momentum last month, sales are still below year ago levels because low inventory is limiting choices for prospective buyers and keeping price growth elevated."
Added Yun, "The residual effects on sales from Hurricanes Harvey and Irma are still seen in parts of Texas and Florida. However, sales should completely bounce back to their pre-storm levels by the end of the year, as demand for buying in these areas was very strong before the storms."
"Listings — especially those in the affordable price range — continue to go under contract typically a week faster than a year ago, and even quicker in many areas where healthy job markets are driving sustained demand for buying," said Yun. "With the seasonal decline in inventory beginning to occur in most markets, prospective buyers will likely continue to see competitive conditions through the winter."
NAR President Elizabeth Mendenhall says the pending tax reform legislation in both the House and Senate is a direct attack on homeowners and homeownership, with the result being a tax increase on millions of middle-class homeowners in both large and small communities throughout the U.S.
"Making changes to the mortgage interest deduction, eliminating or capping the deduction for state and local taxes and modifying the rules on capital gains exemptions poses serious harm to millions of homeowners and future buyers," said Mendenhall. "With first-time buyers struggling to reach the market, Congress should not be creating disincentives to buy and sell a home. Furthermore, adding $1.5 trillion to the national debt will raise future borrowing costs for our children and grandchildren."
Black Knight Financial Services (formerly known as Lender Processing Services) September 2017 home price index Up 0.2 Percent for the Month; Up 6.4 Percent Year-Over-Year. Note that Black Knight uses the current month closings only (not a three month average like Case-Shiller or a weighted average like CoreLogic), excludes short sales and REOs, and is not seasonally adjusted.

Econintersect publishes knowledgeable views of the housing market.
Caveats on the Use of Home Price Indices
The housing price decline seen since 2005 varies by zip code - and seems to have ended somewhere around the beginning of the 2Q2012. Every area of the country has differing characteristics. Since January 2006, the housing declines in Charlotte and Denver are well less than 10%, while Las Vegas home prices had declined almost 60%.
Each home price index uses a different methodology - and this creates slightly different answers.
The most broadly based index is the US Federal Housing Finance Agency's House Price Index (HPI) - a quarterly broad measure of the movement of single-family house prices. This index is a weighted, repeat-sales index on the same properties in 363 metro centers, compared to the 20 cities Case-Shiller.
The US Federal Housing Finance Agency also has an index (HPIPONM226S) based on 6,000,000 same home sales - a much broader index than Case-Shiller. Also, there is a big difference between home prices and owner's equity (OEHRENWBSHNO) which has been included in the graph below.
Comparing Various Home Price Indices to Owner's Equity (blue line)


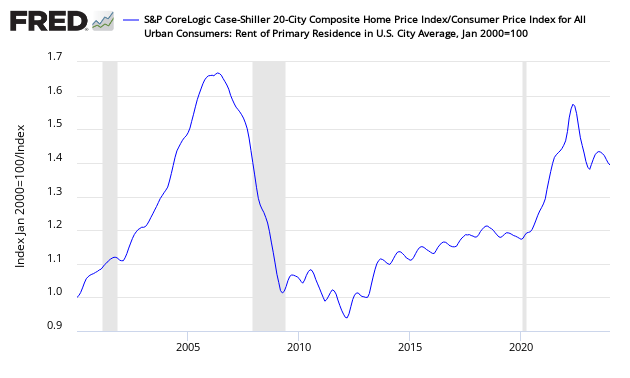
The affordability factor favors rental vs owning.
Price to Rent Ratio - Indexed on January 2000 - Based on Case-Shiller 20 cities index ratio to CPI Rent Index


Comments
Log in or sign up to join the conversation.