

The non-seasonally adjusted Case-Shiller home price index (20 cities) year-over-year rate of home price growth rose from 6.76 % to 6.79 %. The index authors stated " Until inventories increase faster than sales, or the economy slows significantly, home prices are likely to continue rising."

Analyst Opinion of Case-Shiller HPI
Many pundits believe home prices are back in a bubble. Maybe, but the falling inventory of homes for sale keeps home prices relatively high. I continue to see this a situation of supply and demand. It is the affordability of the homes which is becoming an issue for the lower segments of consumers.
- 20 city unadjusted home price rate of growth was unchanged month-over-month. [Econintersect uses the change in year-over-year growth from month-to-month to calculate the change in rate of growth]
- Note that Case-Shiller index is an average of the last three months of data.
- The market expected:
| Consensus Range | Consensus | Actual | |
| 20-city, SA - M/M | 0.6 % to 0.8 % | 0.7 % | +0.5 % |
| 20-city, NSA - M/M | 0.2 % to 0.6 % | 0.5 % | +1.0 % |
| 20-city, NSA - Yr/Yr | 6.3 % to 7.0 % | 6.4 % | +6.8 % |
S&P/Case-Shiller Home Price Indices Year-over-Year Change
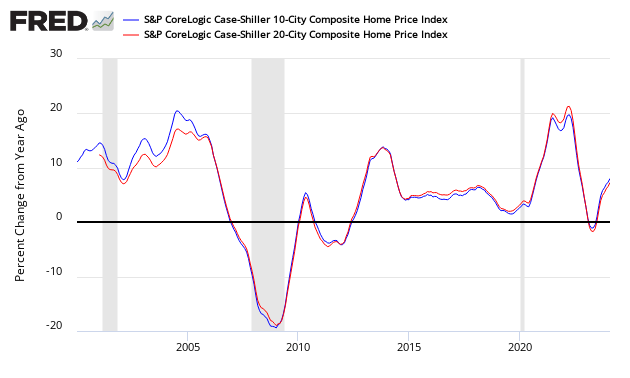
Comparing all the home price indices, it needs to be understood each of the indices uses a unique methodology in compiling their index - and no index is perfect.

The way to understand the dynamics of home prices is to watch the direction of the rate of change. Here home price growth generally appears to stabilize (rate of growth not rising or falling).

There are some differences between the indices on the rate of "recovery" of home prices.
A synopsis of Authors of the Leading Indices:
Case Shiller's David M. Blitzer, Chairman of the Index Committee at S&P Indices:
The home price increases continue with the National Index rising at 6.5% per year. Seattle continues to report the fastest rising prices at 13% per year, double the National Index pace. While Seattle has been the city with the largest gains for 19 months, the ranking among other cities varies. Las Vegas and San Francisco saw the second and third largest annual gains of 12.4% and 11.3%. A year ago, they ranked 10th and 16th. Any doubts that real, or inflation-adjusted, home prices are climbing rapidly are eliminated by considering Chicago; the city reported the lowest 12-month gain among all cities in the index of 2.8%, almost a percentage point ahead of the inflation rate.
Looking across various national statistics on sales of new or existing homes, permits for new construction, and financing terms, two figures that stand out are rapidly rising home prices and low inventories of existing homes for sale. Months-supply, which combines inventory levels and sales, is currently at 3.8 months, lower than the levels of the 1990s, before the housing boom and bust. Until inventories increase faster than sales, or the economy slows significantly, home prices are likely to continue rising. Compared to the price gains of the last boom in the early 2000s, things are calmer today. Gains in the National Index peaked at 14.5% in September 2005, more quickly than Seattle is rising now."
CoreLogic believes low inventories are spurring rising home prices (March 2018 Data). Per Dr. Frank Nothaft, chief economist for CoreLogic and Frank Martell, president and CEO of CoreLogic stated:
Home prices grew briskly in the first quarter of 2018. High demand and limited supply have pushed home prices above where they were in early 2006. New construction still lags historically normal levels, keeping upward pressure on prices.
The dream of homeownership continues to fade away for the average propective buyer. Lower-priced homes are appreciating much faster than higher-priced properties, making the affordability crisis progressively worse. CoreLogic's Market Condition Indicators now indicate that half of the top 50 markets in the country are overvalued because home prices in those areas have risen so much faster than incomes.
The National Association of Realtors says home sales prices continue to increase (April 2018 data):
Lawrence Yun, NAR chief economist, says this spring's staggeringly low inventory levels caused existing sales to slump in April. "The root cause of the underperforming sales activity in much of the country so far this year continues to be the utter lack of available listings on the market to meet the strong demand for buying a home," he said. "Realtors® say the healthy economy and job market are keeping buyers in the market for now even as they face rising mortgage rates. However, inventory shortages are even worse than in recent years, and home prices keep climbing above what many home shoppers are able to afford."
"What is available for sale is going under contract at a rapid pace," said Yun. "Since NAR began tracking this data in May 2011, the median days a listing was on the market was at an all-time low in April, and the share of homes sold in less than a month was at an all-time high."
"With mortgage rates and home prices continuing to climb, an increase in housing supply is absolutely crucial to keeping affordability conditions from further deterioration," said Yun. "The current pace of price appreciation far above incomes is not sustainable in the long run."
"Especially with mortgage rates going up in recent weeks, prospective buyers should visit with more than one lender to ensure they are getting the lowest rate possible," NAR President Elizabeth Mendenhall, a sixth-generation Realtor® from Columbia, Missouri and CEO of RE/MAX Boone Realty. "Receiving a rate quote from multiple lenders could lead to considerable savings over the life of the loan. Ask a Realtor® for a few recommendations of lenders to contact to get a quote."
Black Knight Financial Services (formerly known as Lender Processing Services) March 2018:
- Median home prices rose by 1.24 percent nationally since the start of 2018, with both January and February having their strongest respective single-month growth rates since 2005
- The rate of national home price appreciation has continued to accelerate as interest rates are rising, further tightening affordability in 2018
- Western states are seeing the highest rates of appreciation, representing all 11 markets with 10 percent or higher annual growth
- The median home price in San Jose, Calif., has risen 24.1 percent in the last 12 months to $1.17 million, with the rate of appreciation increasing by more than 18 percent from the 6 percent seen at the start of 2017
- More than half of the nation's 100 largest markets have median home prices less than the $226,000 annual increase seen in San Jose
- Of the nearly 28 million borrowers in 30-year mortgages originated in 2012 or later, fewer than 45,000 have 75 basis points of interest rate incentive to refinance and meet broad-based eligibility requirements
Econintersect publishes knowledgeable views of the housing market.
Caveats on the Use of Home Price Indices
The housing price decline seen since 2005 varies by zip code - and seems to have ended somewhere around the beginning of the 2Q2012. Every area of the country has differing characteristics. Since January 2006, the housing declines in Charlotte and Denver are well less than 10%, while Las Vegas home prices had declined almost 60%.
Each home price index uses a different methodology - and this creates slightly different answers.
The most broadly based index is the US Federal Housing Finance Agency's House Price Index (HPI) - a quarterly broad measure of the movement of single-family house prices. This index is a weighted, repeat-sales index on the same properties in 363 metro centers, compared to the 20 cities Case-Shiller.
The US Federal Housing Finance Agency also has an index (HPIPONM226S) based on 6,000,000 same home sales - a much broader index than Case-Shiller. Also, there is a big difference between home prices and owner's equity (OEHRENWBSHNO) which has been included on the graph below.
Comparing Various Home Price Indices to Owner's Equity (blue line)


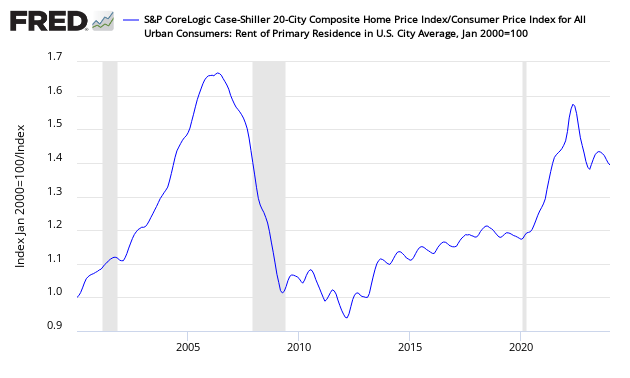
The affordability factor favors rental vs owning.
Price to Rent Ratio - Indexed on January 2000 - Based on Case-Shiller 20 cities index ratio to CPI Rent Index


Comments
Log in or sign up to join the conversation.