


ADA has gained over 7% in the past 24 hours.
The Dijkstra era has begun following the successful Van Rossem hard fork.
Technical indicators point to $0.22 and $0.26 as the next resistance levels.
Cardano's ADA token has climbed more than 7% over the past 24 hours to trade around $0.20, extending its weekly rally as traders have responded to a series of network upgrades.
According to Intersect, development of Cardano's next major protocol phase, the Dijkstra era, has officially started following the successful activation of the Van Rossem hard fork on July 18.
The announcement has renewed attention on the blockchain's long-term roadmap at a time when ADA has broken above the psychological $0.20 level.
The latest rally has not been driven by a single catalyst. Network upgrades, governance progress, cross-chain expansion and improving market sentiment have all arrived within a short period, helping ADA recover from its June lows.
Van Rossem upgraded the network to Version 11 and introduced improvements to Plutus smart contract execution, ledger consistency and node security.
By lowering smart contract execution costs and increasing throughput, the upgrade addressed several performance bottlenecks while laying the foundation for the next development phase.
Attention has now shifted toward Dijkstra, which will be introduced through multiple releases rather than a single network upgrade.
Intersect said the roadmap includes Nested Transactions, Linear Leios and Peras, three technologies developed under the Ouroboros Leios research initiative.
The Haskell node team expects Nested Transactions and Linear Leios to reach the Cardano mainnet before the end of 2026.
Governance development has continued alongside the technical upgrades.
A new parameter update action has opened for community voting, while the Constitutional Committee election is now taking place entirely on-chain.
Intersect also confirmed that the Constitutional Amendment Portal has entered community alpha testing, allowing token holders to begin interacting with another component of Cardano's governance system.
The treasury model remains another part of Cardano's long-term development strategy. Through on-chain governance, ADA holders can directly participate in funding future ecosystem development instead of relying on centralised decision-making.
Interoperability has also become part of the recent bullish narrative.
Cardano and Injective activated the first Inter-Blockchain Communication (IBC) testnet connection on Aug. 4, creating the first trustless bridge between the Cardano and Cosmos ecosystems.
The integration allows assets such as ADA and INJ to move between the two networks without relying on centralised intermediaries.
Unlike Injective, which supports IBC through the Cosmos SDK, Cardano required dedicated infrastructure to make the connection possible.
Developers built specialised modules that translate Cardano's Extended UTXO accounting model into Injective's account-based architecture, making communication between the two blockchains possible.
ADA price analysis
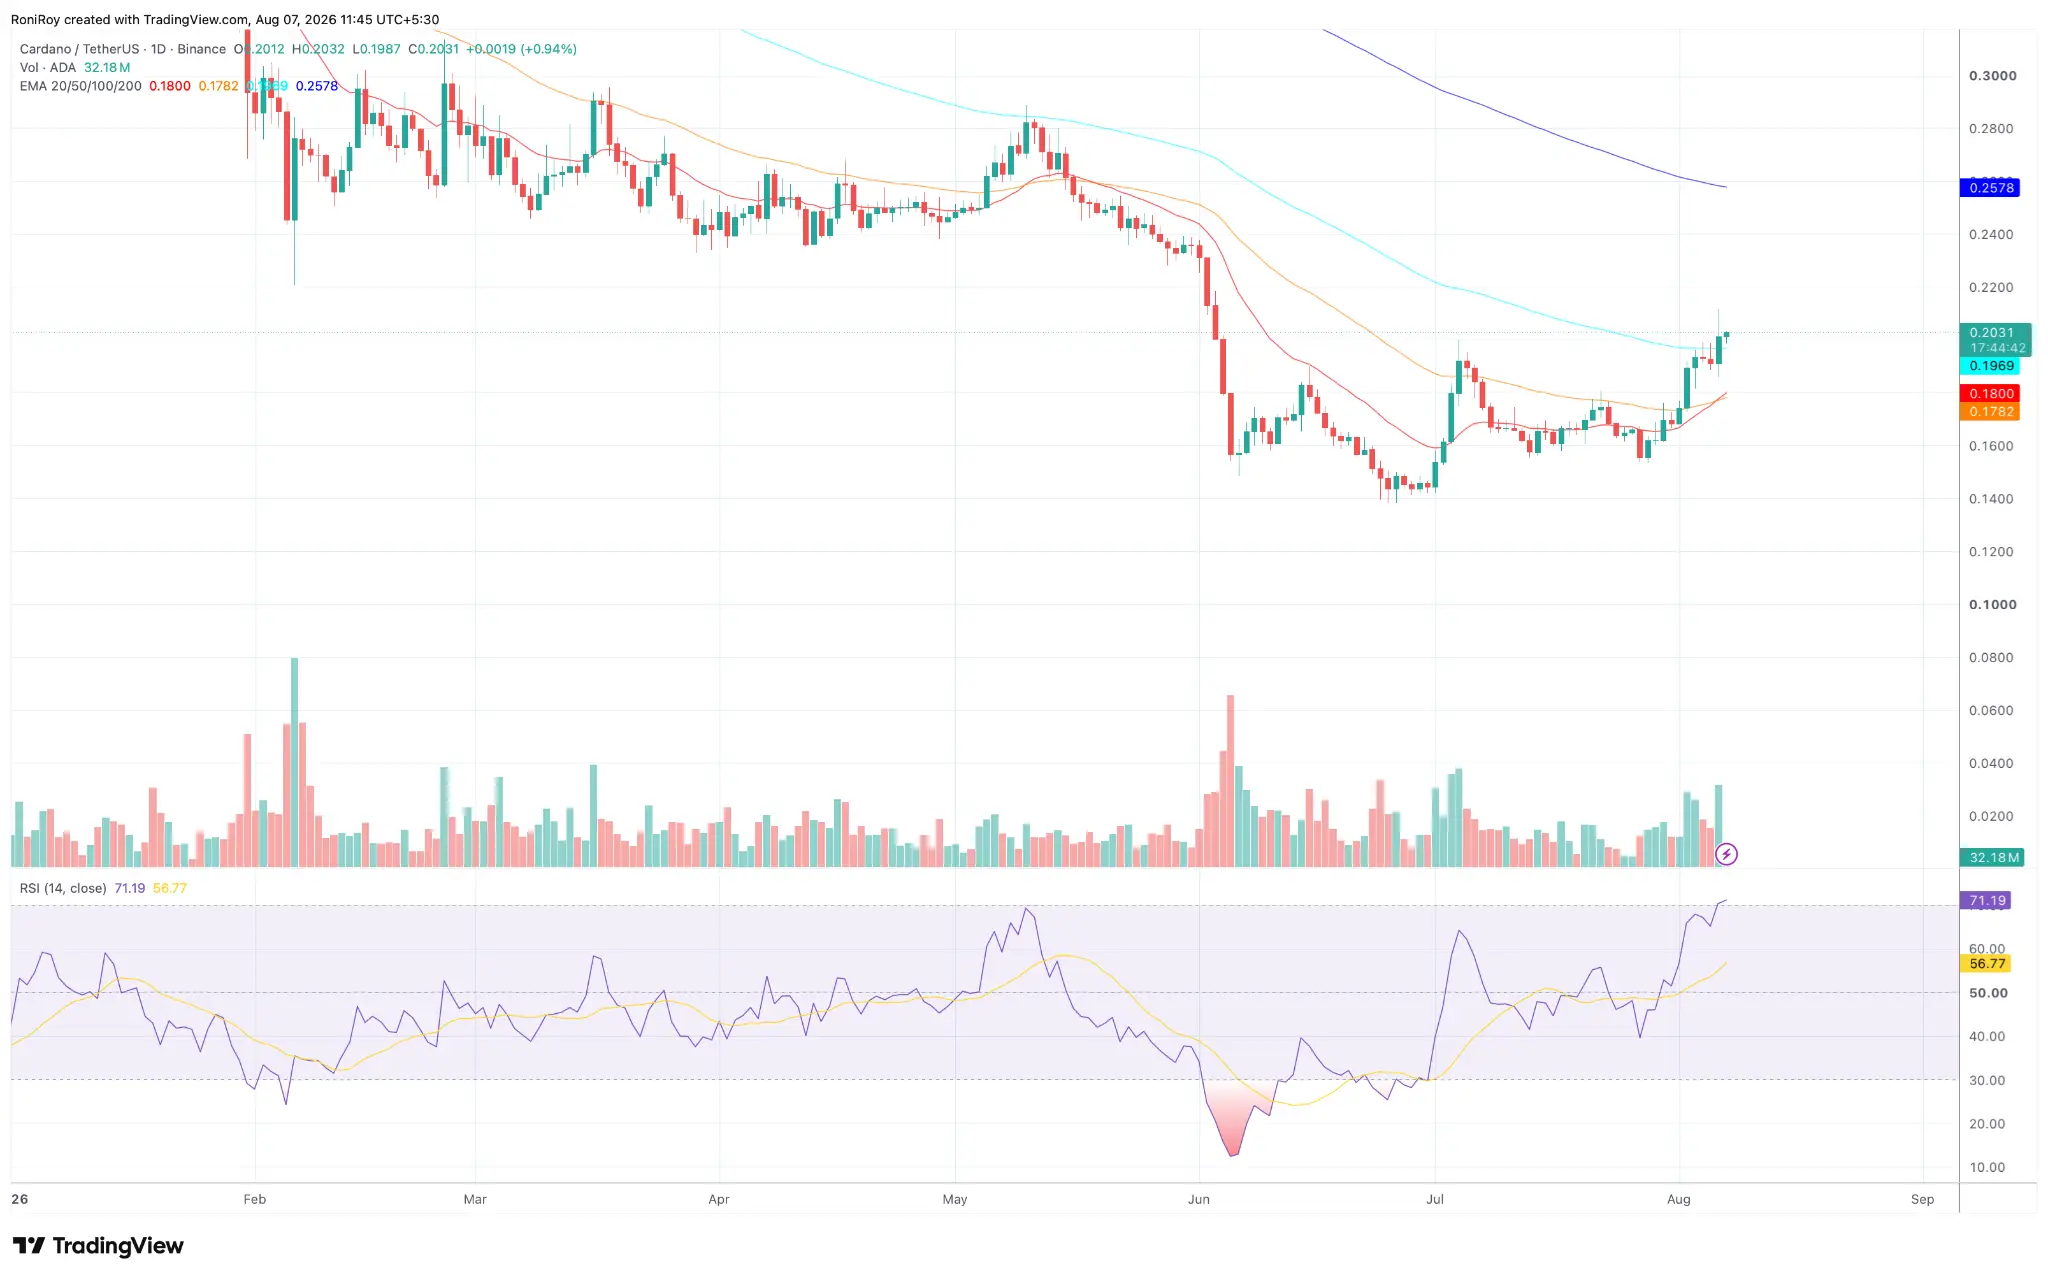
The daily chart shows ADA has completed a strong recovery from its June low near $0.14 and has reclaimed the important $0.20 level for the first time in several months.
ADA/USDT 1-day price chart. Source: TradingView.
The latest advance has pushed the token above both the 20-day and 50-day exponential moving averages, indicating that short-term momentum has strengthened.
The 20 EMA sits near $0.18 while the 50 EMA is close to $0.178.
Price holding above both averages indicates buyers have regained control of the recent trend after several weeks of consolidation.
Even so, the recovery is approaching its next technical hurdle.
The 100-day EMA remains near $0.22, while the 200-day EMA sits around $0.258.
Both averages acted as resistance earlier this year and could become the next areas where traders take profits if the current rally continues.
ADA’s Relative Strength Index has climbed to around 71, placing ADA in overbought territory.
Although elevated RSI readings can sometimes precede short-term pullbacks, they also appear during strong trending markets when buying pressure continues for an extended period.
Volume has increased alongside the breakout, adding confirmation that recent buying has been supported by stronger participation rather than thin trading activity.
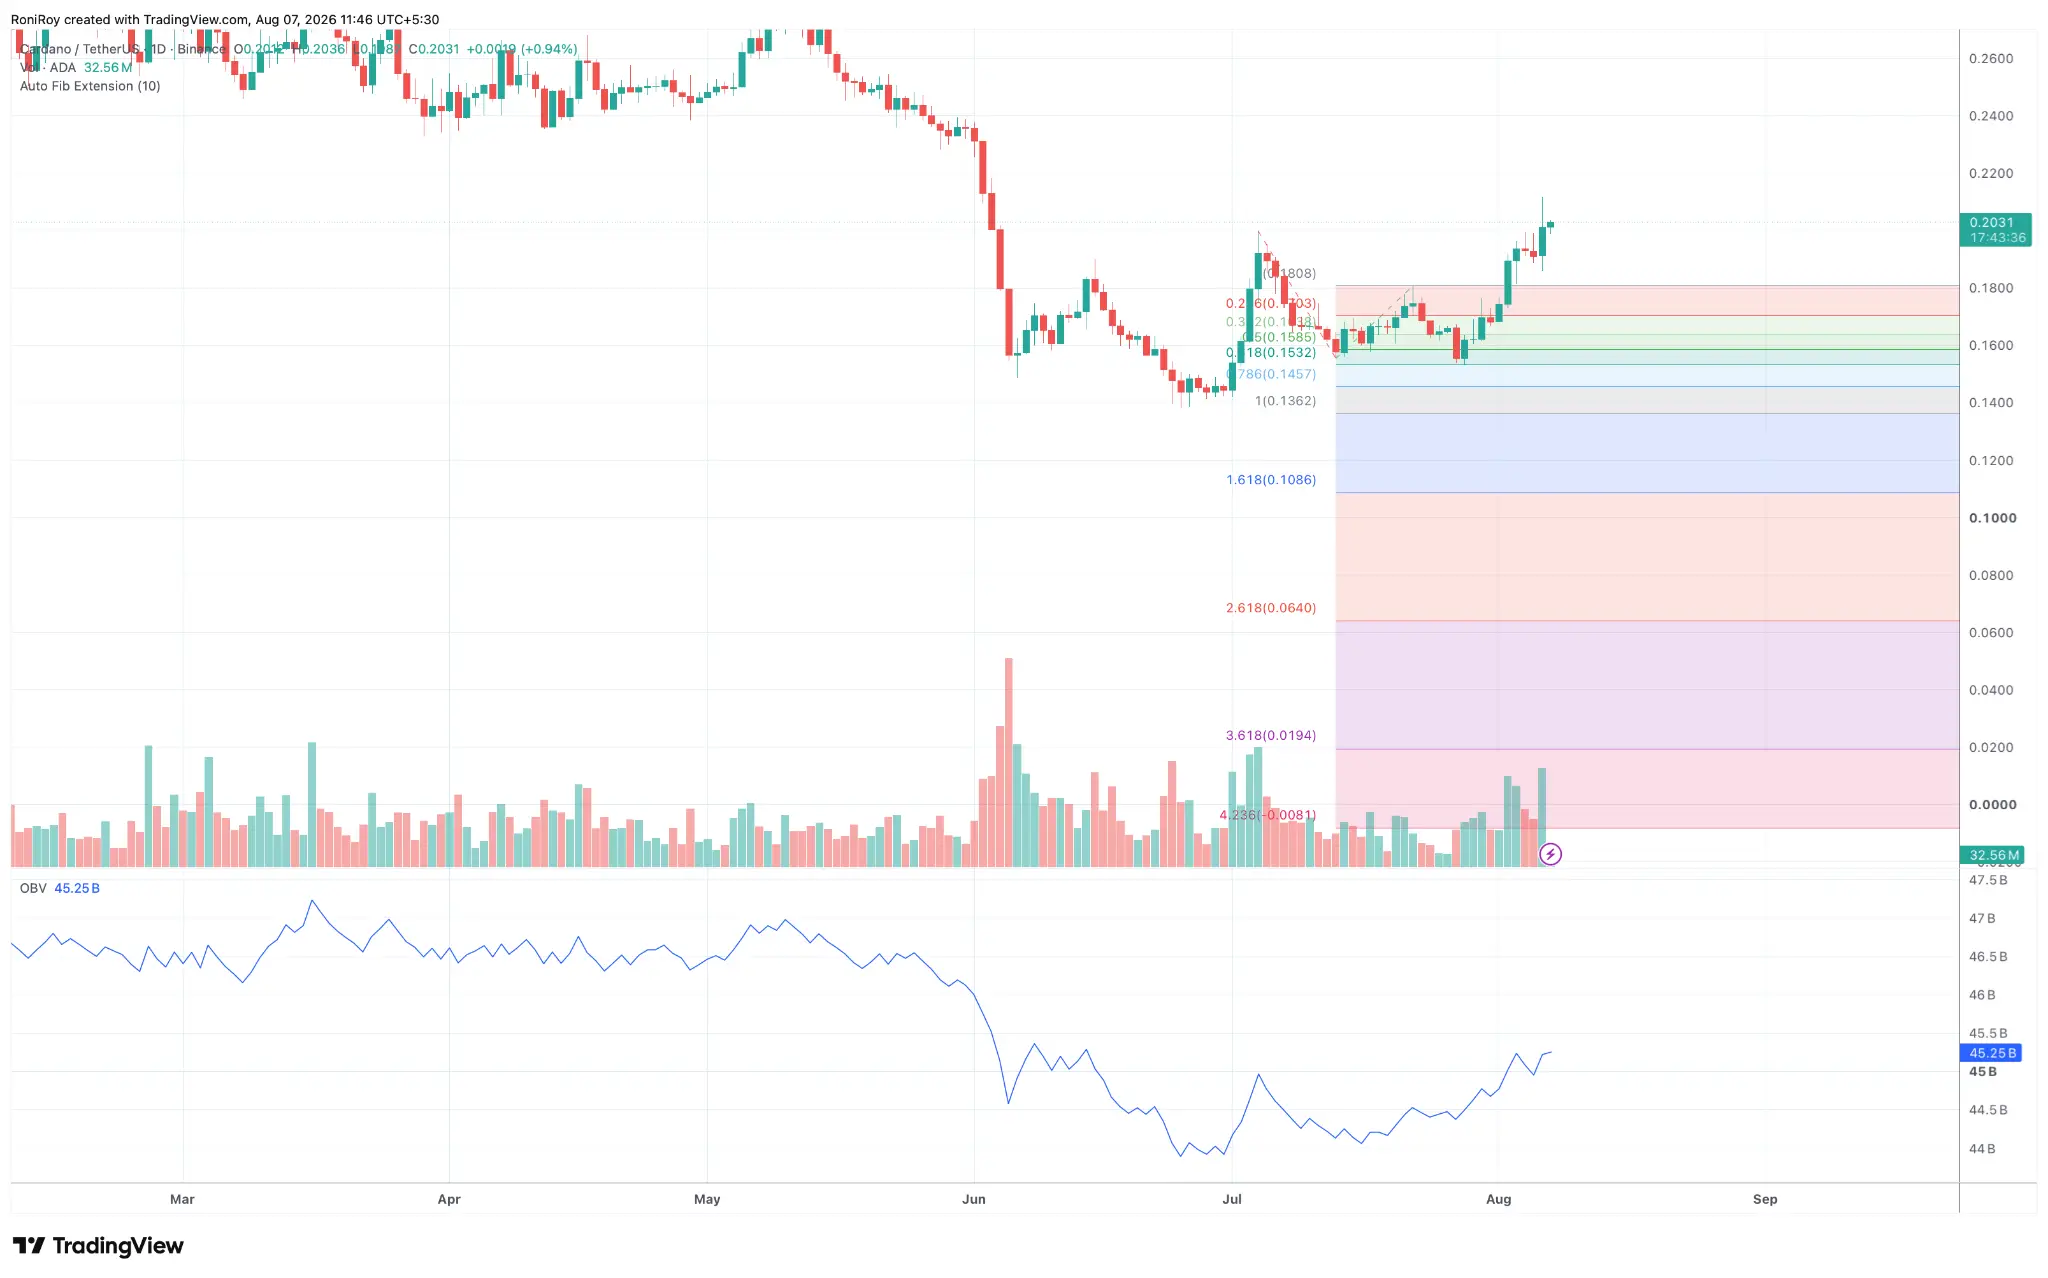
ADA’s On-Balance Volume has continued trending upward as ADA advanced, showing that accumulation has accompanied the recent move.
See below:
ADA/USDT 1-day price chart. Source: TradingView.
Rising OBV together with higher prices often indicates sustained buying interest rather than temporary speculative spikes.
The Fibonacci extension chart also shows ADA trading above its previous swing high around $0.18 after reclaiming key retracement levels from the June decline.
Holding above that breakout area would strengthen the current structure if buyers continue defending the level.
From here, the first area to monitor remains the 100 EMA around $0.22.
A decisive move above that level could expose the next major resistance near the 200 EMA around $0.258, which also aligns with an area where sellers previously regained control.
On the downside, the reclaimed 20 EMA near $0.18 now serves as the first technical support.
Below that, the Fibonacci retracement zone between roughly $0.16 and $0.17 could become the next area where buyers attempt to stabilise price if profit-taking increases.



Comments
Log in or sign up to join the conversation.