

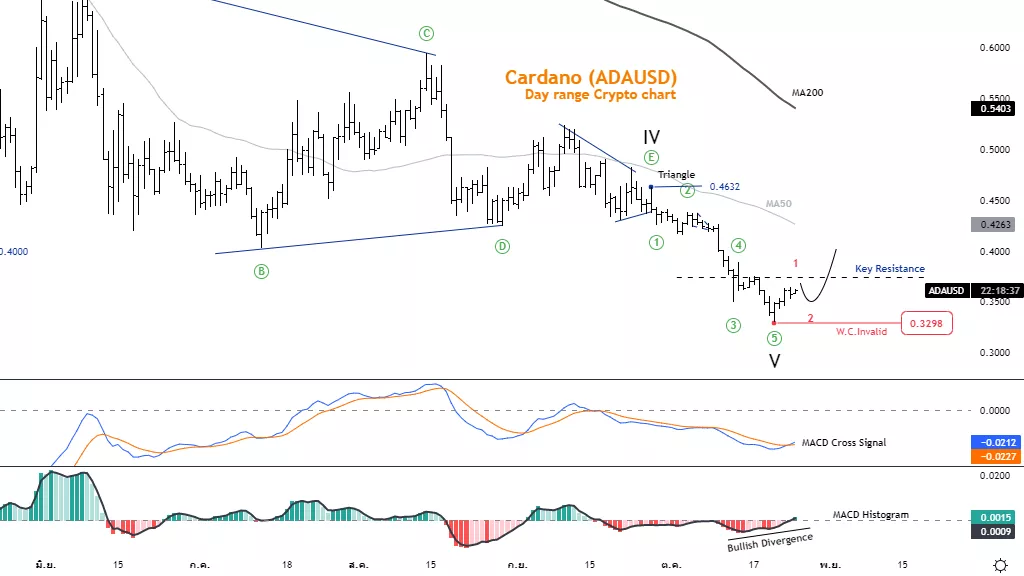
Elliott Wave Analysis TradingLounge Daily Chart, 25 October 2022, Cardano (ADAUSD)
ADAUSD Elliott Wave Technical Analysis
Function: Follow trend
Mode: Motive
Structure: Impulse
Position: Wave 1
Direction Next higher Degrees: Sub-wave of Wave (1)
Details: Wave 5 may end and the price is on the uptrend again. but must not reverse below 0.329
Wave Cancel invalid Level: 0.3890
Cardano (ADAUSD)Trading Strategy: Wave ((5) is likely to end at the 0.329 level and the price is reverting to an uptrend. But since it is the first phase of the trend, there is a chance of correction, where the retracement does not make a new low as an opportunity to rejoin the trend.
Cardano (ADAUSD)Technical Indicators: MACD Histogram has Bullish divergence and MACD Cross signal line Bullish momentum The price has a chance of reversal.
(Click on image to enlarge)
Cardano (ADAUSD)
ADAUSD Elliott Wave Technical Analysis
Function: Follow trend
Mode: Motive
Structure: Impulse
Position: Wave 1
Direction Next higher Degrees: Sub-wave of Wave (1)
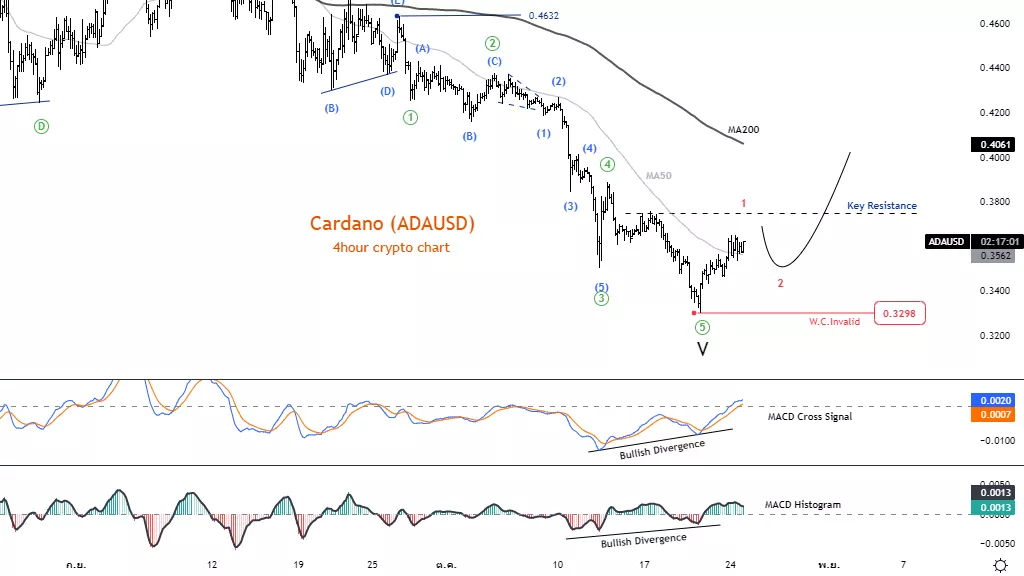
Details: Wave 5 may end and the price is on the uptrend again. but must not reverse below 0.329
Wave Cancel invalid Level: 0.3890
Cardano (ADAUSD)Trading Strategy: Wave ((5) is likely to end at the 0.329 level and the price is reverting to an uptrend. But since it is the first phase of the trend, there is a chance of correction, where the retracement does not make a new low as an opportunity to rejoin the trend.
Cardano (ADAUSD)Technical Indicators: MACD Histogram and MACD have Bullish divergence The price has a chance of reversal.
More By This Author:
ASX200, CBA, IRON ORE, BHP, RIO, FMG, NCM, DXY, AUDUSD 2Yr Bonds Elliott Wave Technical Analysis
DAX 40 Today | DAX 40 Index Chart And Forecasts
Elliott Wave Technical Analysis: Texas Instruments, Oct. 24



Comments
Log in or sign up to join the conversation.