
The Canadian Dollar remains the strongest performer against the US Dollar since the start of the year with USD/CAD down 3.8% into the open February trade. These are the updated targets and invalidation levels that matter on the USD/CAD charts.
USD/CAD DAILY PRICE CHART
(Click on image to enlarge)
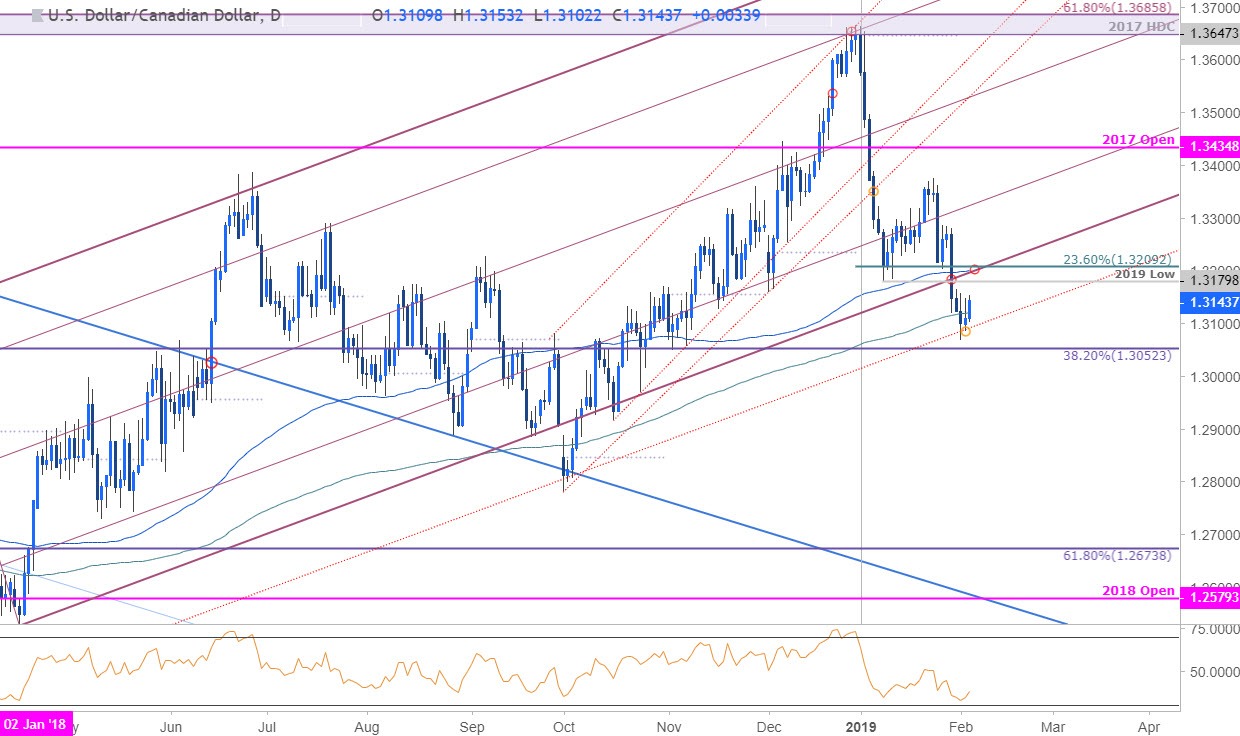
Technical Outlook: In my latest USD/CAD Weekly Technical Outlook we noted that the price was approaching a key weekly support barrier at, “1.3037/52- a region defined by the 52-week & 200-week moving averages and the 38.2% retracement of the 2017 advance. Note that a basic trendline extending off the 2018 low also converges on this region and further highlights its technical significance.” Price registered a low 1.3068 last week before rebounding with the recovery taking USD/CAD back above the 200-day moving average at ~1.3120.
USD/CAD 120MIN PRICE CHART
(Click on image to enlarge)
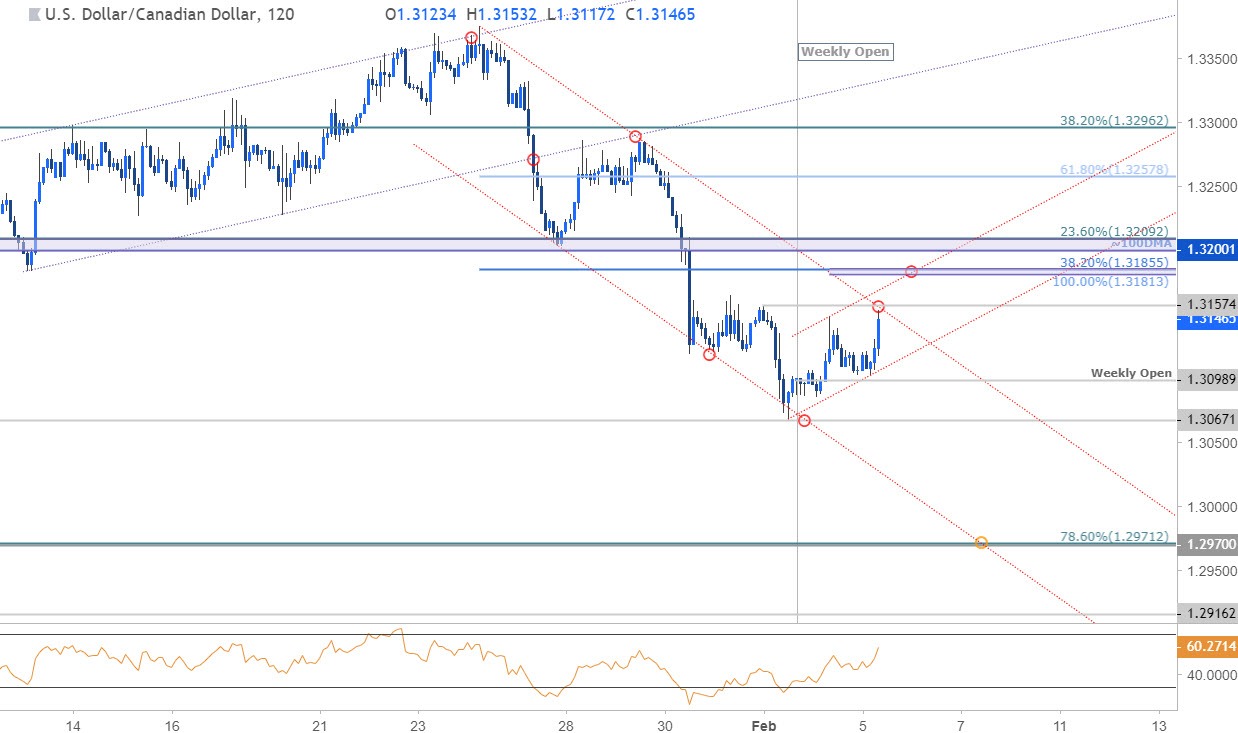
Notes: A closer look at price action shows USD/CAD continuing to trade within the confines of the descending channel formation extending off the late-January high with immediate resistance eyed at the upper parallel / Friday high at 1.3157. A breach above this region would expose 1.3181/86 with near-term bearish invalidation at the 100-day moving average / 23.6% retracement at 1.3200/09 – both zones of interest for possible exhaustion / short-entries. Weekly open support rests at 1.3099 – look for a move below this threshold to mark resumption with subsequent support objectives eyed at 1.3067 and 1.2970/71.
Bottom line: The near-term USD/CAD recovery is approaching initial resistance zones and IF price is indeed heading lower, the advance should see exhaustion ahead of 1.3209. From a trading standpoint, we’re on the lookout for possible short-entries with a downside break of this near-term channel needed to threaten the broader January 2018 support line.
USD/CAD TRADER SENTIMENT
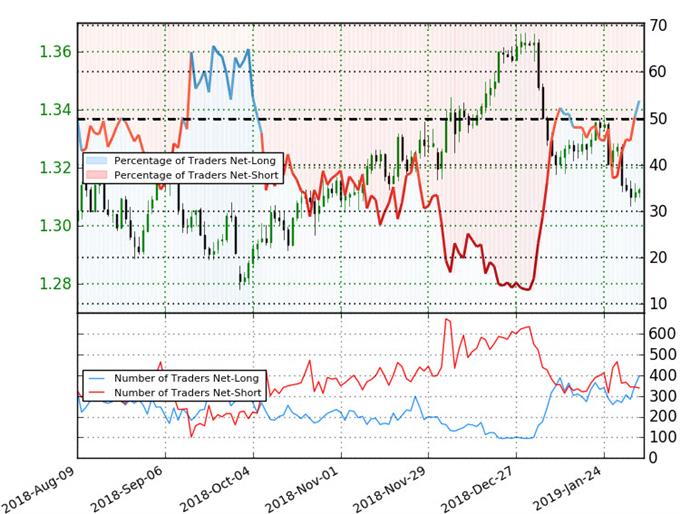
- A summary of IG Client Sentiment shows traders are net-long USD/CAD - the ratio stands at +1.17 (53.8% of traders are long) – neutral reading
- The percentage of traders net-long is now its highest since January 8th
- Long positions are20.1% higher than yesterday and 51.0% higher from last week
- Short positions are 1.1% lower than yesterday and 29.6% lower from last week
- We typically take a contrarian view to crowd sentiment, and the fact traders are net-long suggests USD/CAD prices may continue to fall. Traders are further net-long than yesterday & last week, and the combination of current positioning and recent changes gives us a stronger USD/CAD-bearish contrarian trading bias from a sentiment standpoint.


Comments
Log in or sign up to join the conversation.