


The USD/CAD pair weakens to around 1.4025 during the early European trading hours on Thursday. The pair hits the lowest since September 21 as elevated crude oil prices underpin the commodity-linked Canadian Dollar (CAD) against the US Dollar (USD). The weekly US Initial Jobless Claims data is due later on Thursday. On Friday, Canada’s Retail Sales and US Purchasing Managers Index (PMI) reports will be the highlights.
The Bank of Canada (BoC) has held its key interest rate unchanged for about a year, but some economists anticipate rates to begin rising again at the upcoming policy meeting next week, which would be the first hike in more than three years.
Swap market data indicates an 80% probability the Canadian central bank lifts its benchmark interest rate by 25 basis points (bps) to 2.50% on October 28, according to Reuters.
Meanwhile, crude oil prices jumped as tensions between the US and Iran deepened. Iranian Foreign Minister Abbas Araqchi said that there was little reason to expect progress in talks with Washington, adding that Tehran was fully prepared to defend itself, per the Financial Times.
Iranian President Masoud Pezeshkian stated that the US could not expect Tehran to engage in dialogue while continuing to blockade and threaten it. It is worth noting that Canada is a major oil-exporting country, and high crude oil prices generally have a positive impact on the Loonie.
USD/CAD under pressure as IMF highlights widening North American growth gap
Strategists at Societe Generale highlight that the latest IMF projections underscore a growing divergence in North American prospects, with the Fund now seeing US growth at “2.5% this year (while remaining at 2.1% in 2027),” a profile that contrasts with a notably softer outlook for Canada. They note that “the North American growth gap is widening,” pointing out that while “the chart on the right shows relative Bloomberg consensus growth forecasts for 2027, … the IMF’s assessment (1.2% growth in Canada next year versus 2.1% in the US) is even less favourable for Canada.” Against this backdrop, Societe Generale draw attention to the policy and market backdrop, observing that “the chart on the left shows the two-year rate differential plotted against USD/CAD,” underlining the importance of relative rate expectations in shaping the Canadian Dollar’s performance.
Warsh flags investment surge and AI risks while keeping Fed options open
Fed Chair Warsh delivered a moderately cautious tone, with the FXS Speechtracker score of 5.6/10 coming in slightly below the 6.1/10 historical average, suggesting a touch less conviction than the established baseline. The admission of being “over-scarred” by the Global Financial Crisis, combined with emphasis on structural growth, an investment surge, and upcoming “crystalizing” meetings, underscores a risk-aware stance that balances optimism on investment and AI with sensitivity to downside and financial stability risks. Warsh’s refusal to pre-commit on October and December decisions, and focus on AI’s uncertain near-term employment impact, reinforces a data-dependent posture that tempers any overtly hawkish signal for the Dollar.
The FXS Fed Sentiment Index was unchanged, rising by 0.00 points to a still-elevated 127.51, indicating that despite the slightly softer FXS Speechtracker score, the broader policy signal remains firmly in hawkish territory. This stable, above-100 reading suggests markets continue to price a Fed that is committed to price stability and attentive to investment- and AI-driven upside risks, even as near-term guidance remains deliberately non-committal.
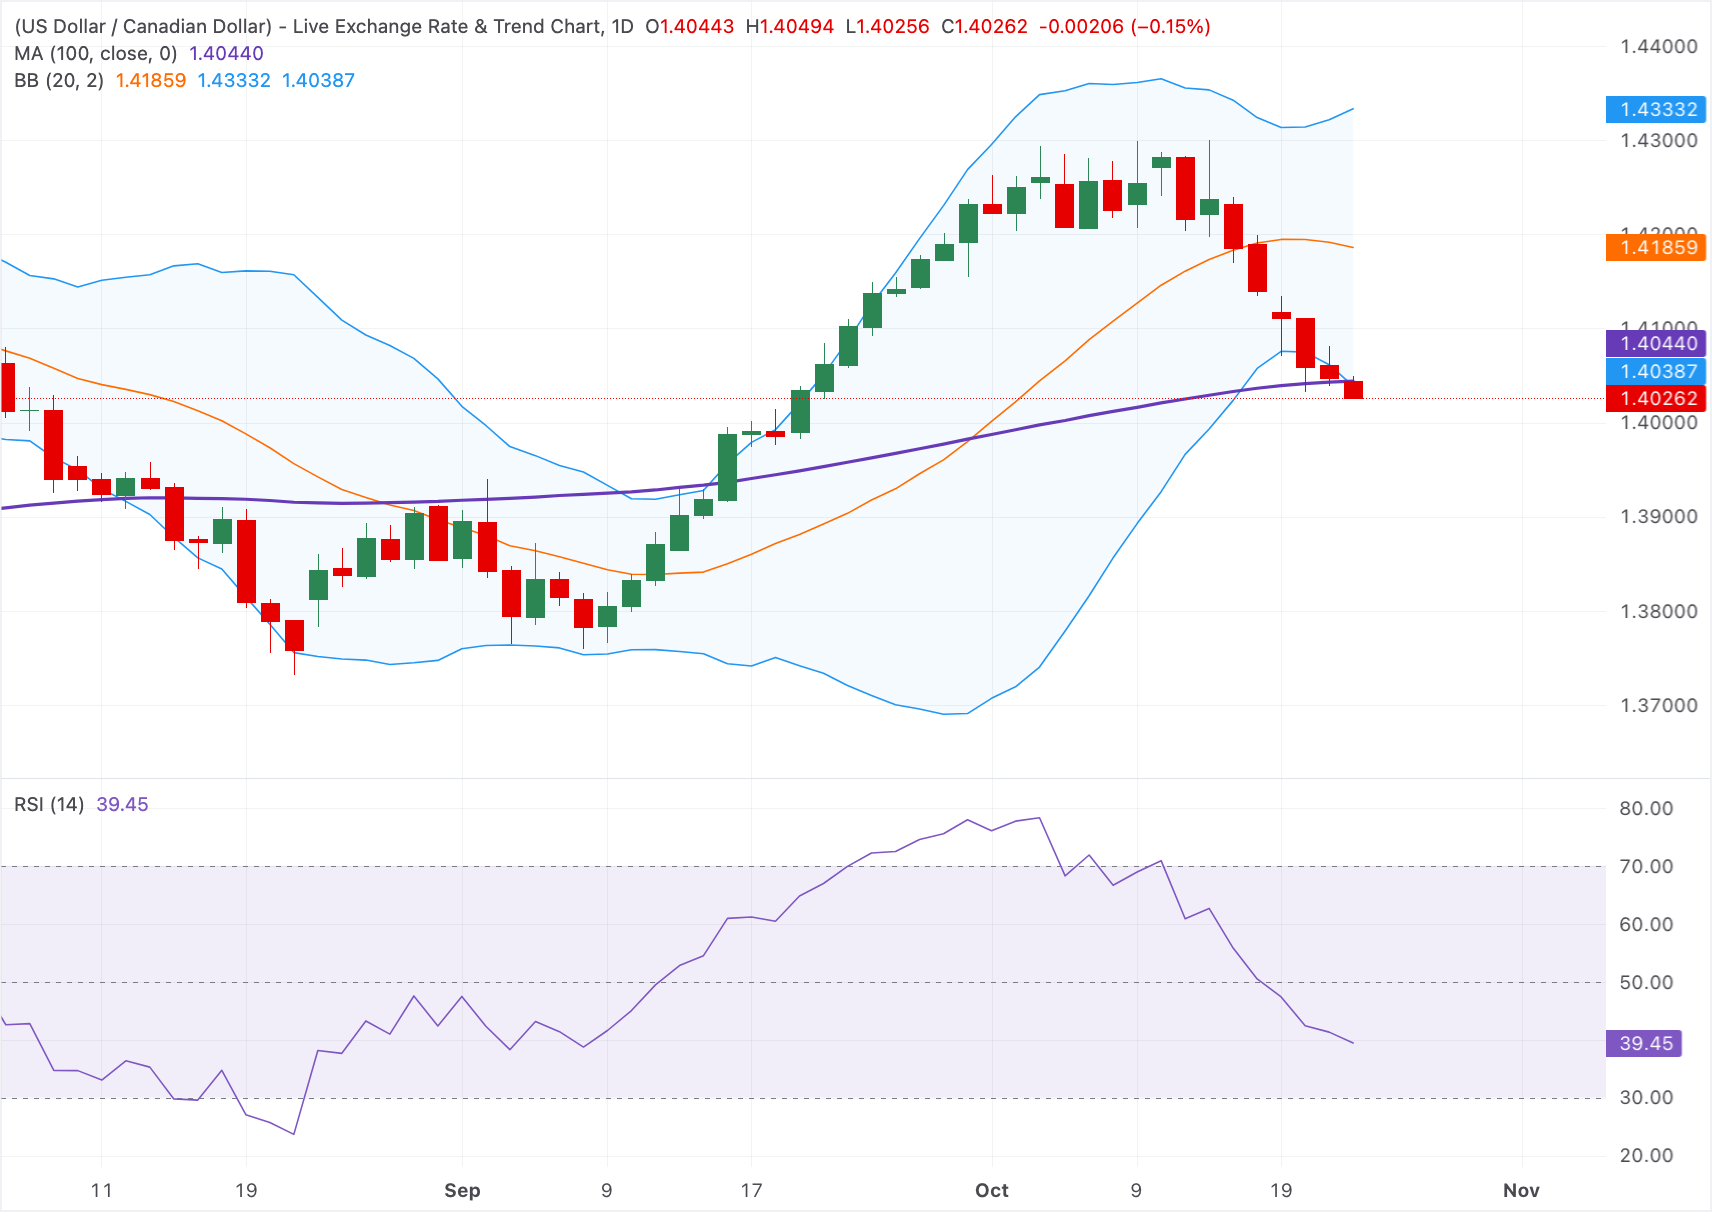
Technical Analysis: Negative tone of USD/CAD remains intact below the 100-day SMA
On the topside, immediate resistance is seen in the 1.4040-1.4045 zone, representing the lower Bollinger band and the 100-day moving average. Any follow-through buying above this zone would ease the immediate downside pressure and open the way toward the Bollinger midline around 1.4190 and the upper band near 1.4330.
On the downside, the key support level emerges at the 1.4000 psychological level, followed by the August 31 high of 1.3912. Further south, the next contention level to watch is the September 8 low of 1.3760.



Comments
Log in or sign up to join the conversation.