

If during the month of February we commented on the positive results of Shopify (SHOP) during the past year, thanks to the boost that e-commerce has experienced due to the COVID-19 pandemic, in recent sessions we have been able to observe how this company is making a strong bullish rally that has led it to mark new all-time highs.
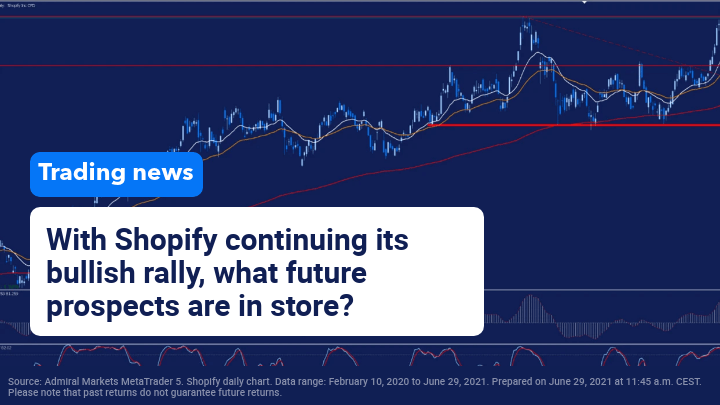
So far this year, this company is revaluing by 32.07%, also obtaining positive results during the first quarter of the year that led it to obtain strong earnings per share of $2.01 per share compared to the $0.74 expected by the market consensus. In these results presented last April, we also observed that revenues exceeded expectations to reach $988.65 million.
As we can see in the daily chart, since the beginning of the pandemic, this company has experienced a strong revaluation in the financial markets from $300 to over $1,550 per share.
(Click on image to enlarge)

In addition to the positive results, during the last few sessions, we have witnessed the company’s announcement that its mobile payment technology will arrive on Facebook, Instagram and Google later this year, even if customers do not use the Shopify online store.
If we look at the same chart as before but expanded, we can see that after breaking the downtrend line higher on June 14 in discontinuous red, the price has experienced a strong rally that has led it to mark new all-time highs.
Currently, the price is in a correction that has led it to bounce off the 23.6% Fibonacci retracement level, trading at levels of its previous all-time high. If the price manages to maintain these levels we may see a new upward momentum that can mark new all-time highs.
On the contrary, we can overbought its stochastic indicator so we cannot rule out further correction given that it is currently trading far away from its main support level at its average of 18 blank sessions.
(Click on image to enlarge)

Source: Admiral Markets MetaTrader 5. Shopify daily chart. Data range: October 19, 2020 to June 29, 2021. Prepared on June 29, 2021 at 11:45 a.m. CEST. Please note that past returns do not guarantee future returns.
Evolution in the last 5 years:
- 2020: 184,71%
- 2019: 187,17%
- 2018: 37,08%
- 2017: 135,60%
- 2016: 66,16%



Comments
Log in or sign up to join the conversation.