


Cameco Corporation (CCJ) is one of the world's largest uranium producers and a leading supplier of nuclear fuel products used by electric utilities worldwide. Headquartered in Saskatchewan, Canada, the company operates high-grade uranium mines and processing facilities that play a critical role in the global nuclear energy supply chain. In the following charts, we look at the long term Elliott Wave technical outlook.
Cameco (CCJ) Monthly Elliott Wave Chart
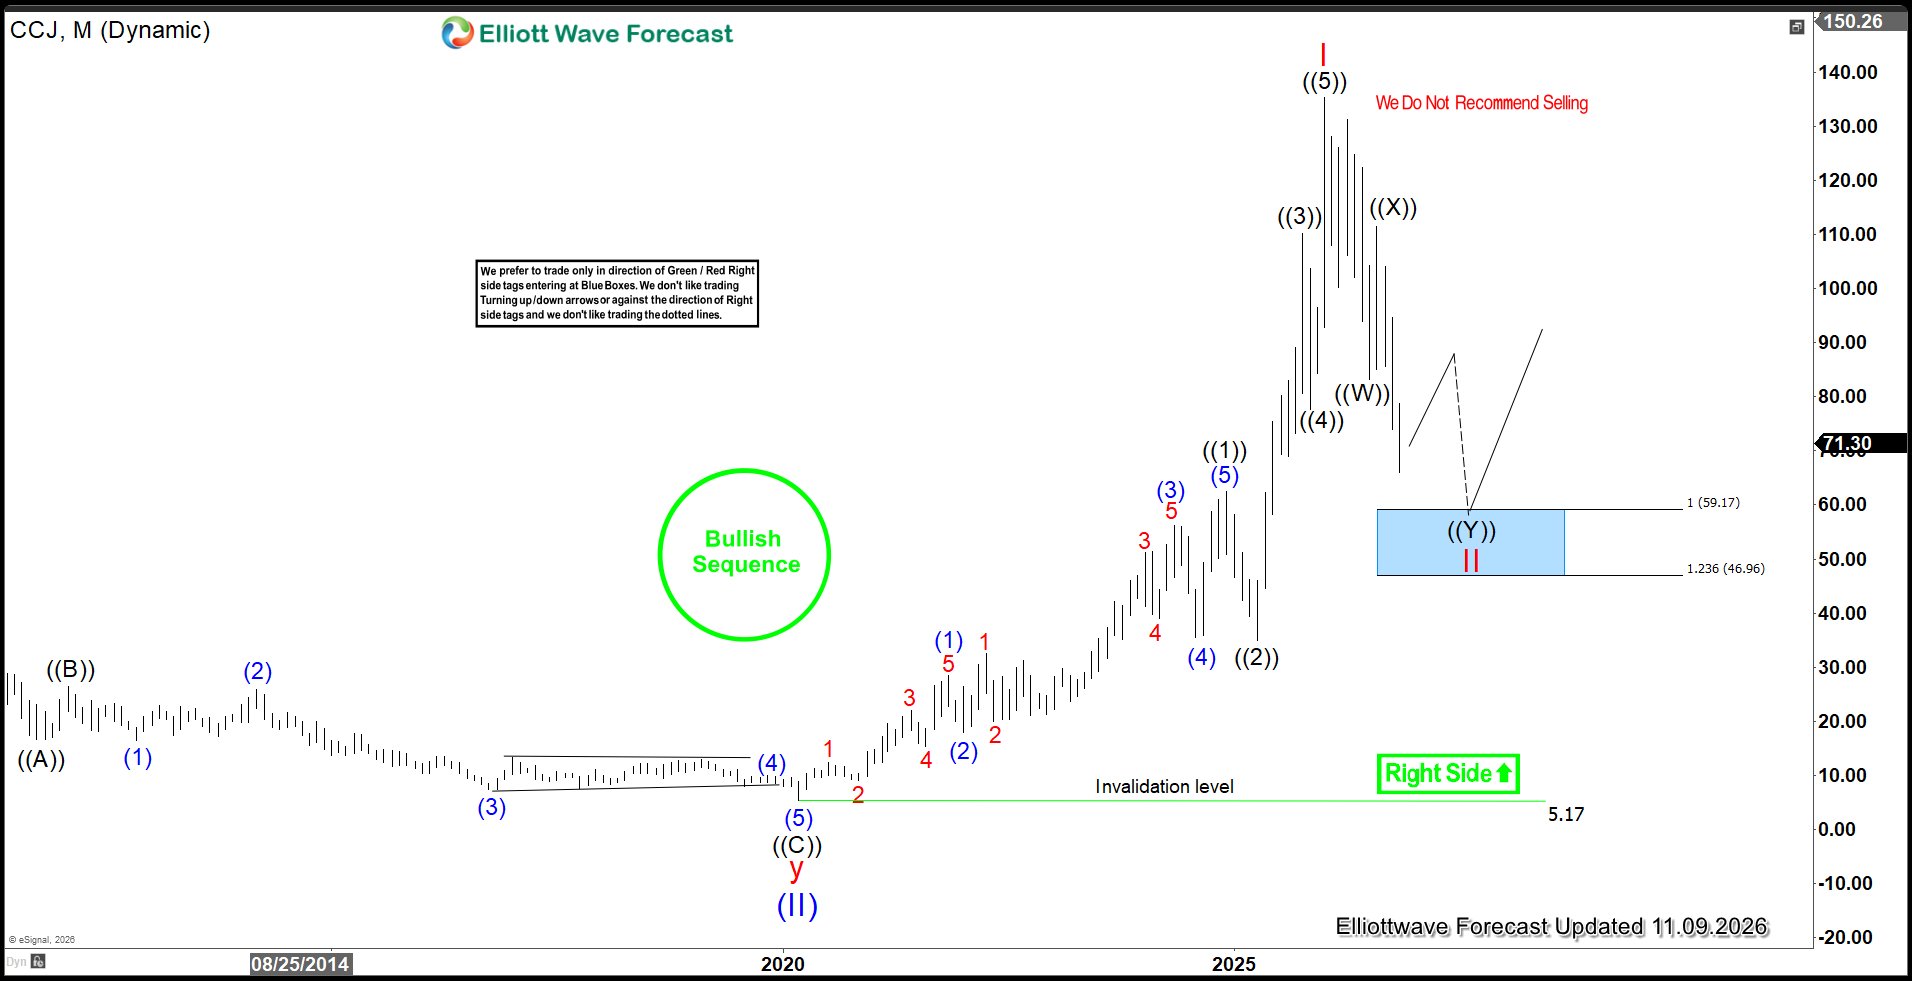
The monthly Elliott Wave analysis of Cameco (CCJ) suggests that Super Cycle wave (II) completed at the March 2020 low of $5.17. From that pivotal bottom, the stock commenced a powerful impulsive advance in Super Cycle wave (III). The first major subdivision, wave I of (III), topped earlier this year at $135.24. Since then, CCJ has been correcting in wave II of (III). The pullback is taking a shape as a larger-degree double three pattern. This corrective structure is expected to complete a seven-swing decline from the April 1, 2025 low, with support projected in the $57-$59 area before the next bullish leg resumes.
CCJ Daily Elliott Wave Chart
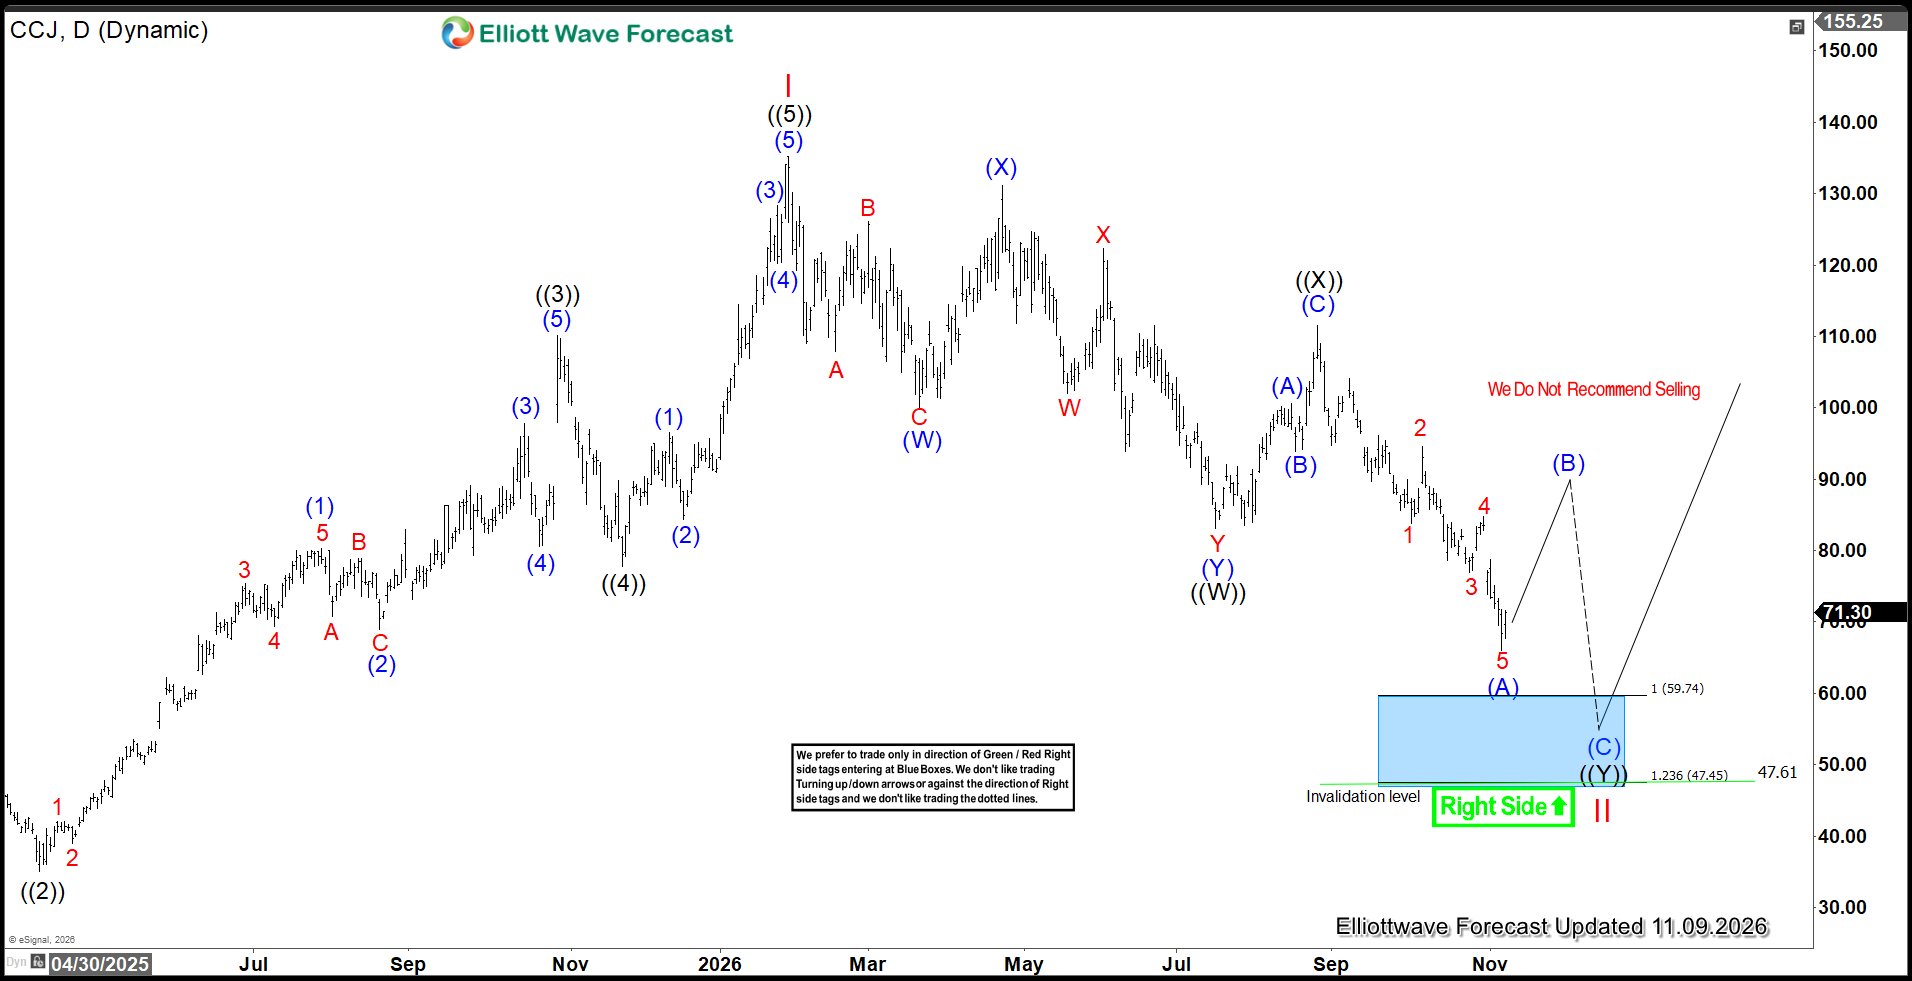
The daily Elliott Wave analysis of Cameco (CCJ) suggests that Cycle wave I completed its advance earlier this year at $135.24. Since then, the stock has entered a corrective Cycle wave II, which is developing as a double three pattern. Within this structure, wave ((W)) concluded at $83.15, followed by a recovery in wave ((X)) that peaked at $111.54. The next leg lower in wave ((Y)) should extend toward the 100% - 123.6% Fibonacci extension area of wave ((W)). This places the ideal support zone between $47 and $59. This blue box region should attract buyers for either a resumption of the broader bullish trend or, at minimum, a meaningful three-wave recovery.



Comments
Log in or sign up to join the conversation.