

CADJPY Technical Outlook
CADJPY has been trading in a steady uptrend over the last six months, suggesting the market may be forming a bullish Elliott Wave impulse structure. Although the pair has already advanced significantly, the upside potential for this year may still exist if the current structure completes a full five-wave sequence from the 105 area.
The recent price slowdown appears to be developing into a corrective phase. CADJPY is currently reacting around the 38.2% Fibonacci retracement level, a rising channel support line, and a former swing high, which together create an important technical support zone.
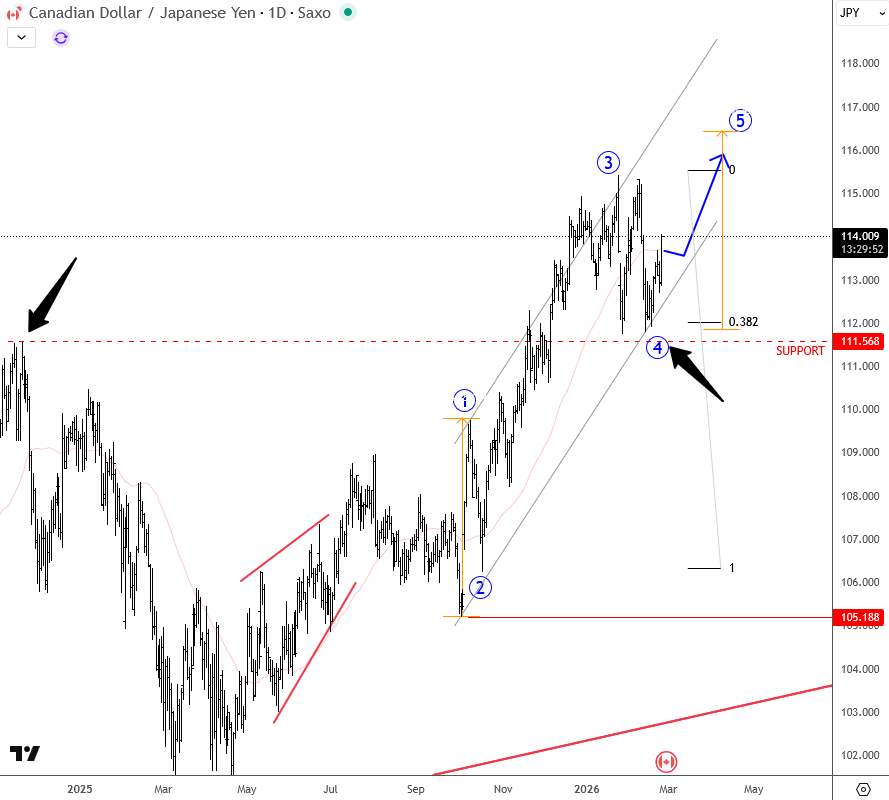
CADJPY Daily Chart
This area near 111 is an ideal region for a wave 4 correction to stabilize. If buyers defend this support, the pair could resume its broader uptrend and begin a potential wave 5 advance.
A confirmed bounce from current levels would open the door for a move toward the 116–117 area, which represents a realistic upside target for the completion of the bullish cycle.
Elliott Wave Bullish Impulse Pattern Explained
The Elliott Wave bullish impulse pattern is a five-wave structure that develops in the direction of the main trend. It consists of three impulsive waves (1, 3, and 5) and two corrective waves (2 and 4).
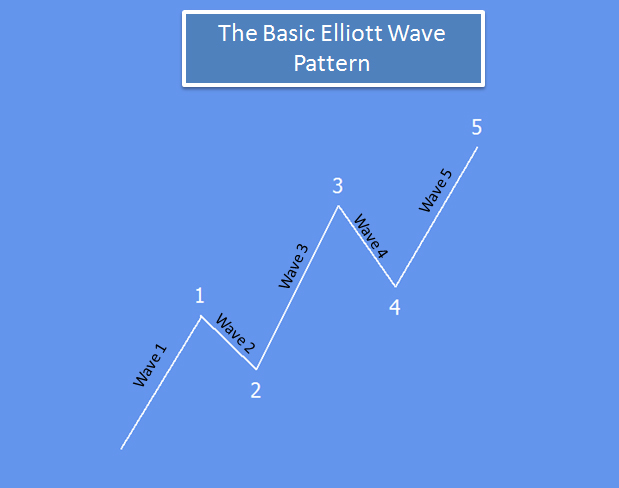
Wave 1 begins the new trend.
Wave 2 is a corrective pullback that typically retraces part of wave 1.
Wave 3 is usually the strongest and longest wave, driven by increasing market participation.
Wave 4 forms a consolidation or correction, often respecting Fibonacci retracement levels and prior support zones.
Wave 5 represents the final push in the trend direction before a larger correction develops.
In bullish market conditions, wave 4 corrections often provide attractive opportunities for trend continuation setups, particularly when they align with Fibonacci support and trend channel boundaries.


Comments
Log in or sign up to join the conversation.