

CADCHF has formed a symmetrical triangle on the daily time frame, with lower highs and higher lows converging toward an apex around the 0.5750 minor psychological area.
Price is currently testing the lower boundary of the formation after bouncing off the triangle support, so a move back toward the upper boundary could be in the cards.
If the triangle floor holds as a floor, CADCHF could make its way back up to the upper trend line resistance near 0.5750, which also coincides with the triangle apex. A break above this level could set off a larger rally toward the swing high around 0.58000 or higher.
On the other hand, a break below the triangle support could trigger a sharper drop toward the lows around the 0.5650 minor psychological level or lower.
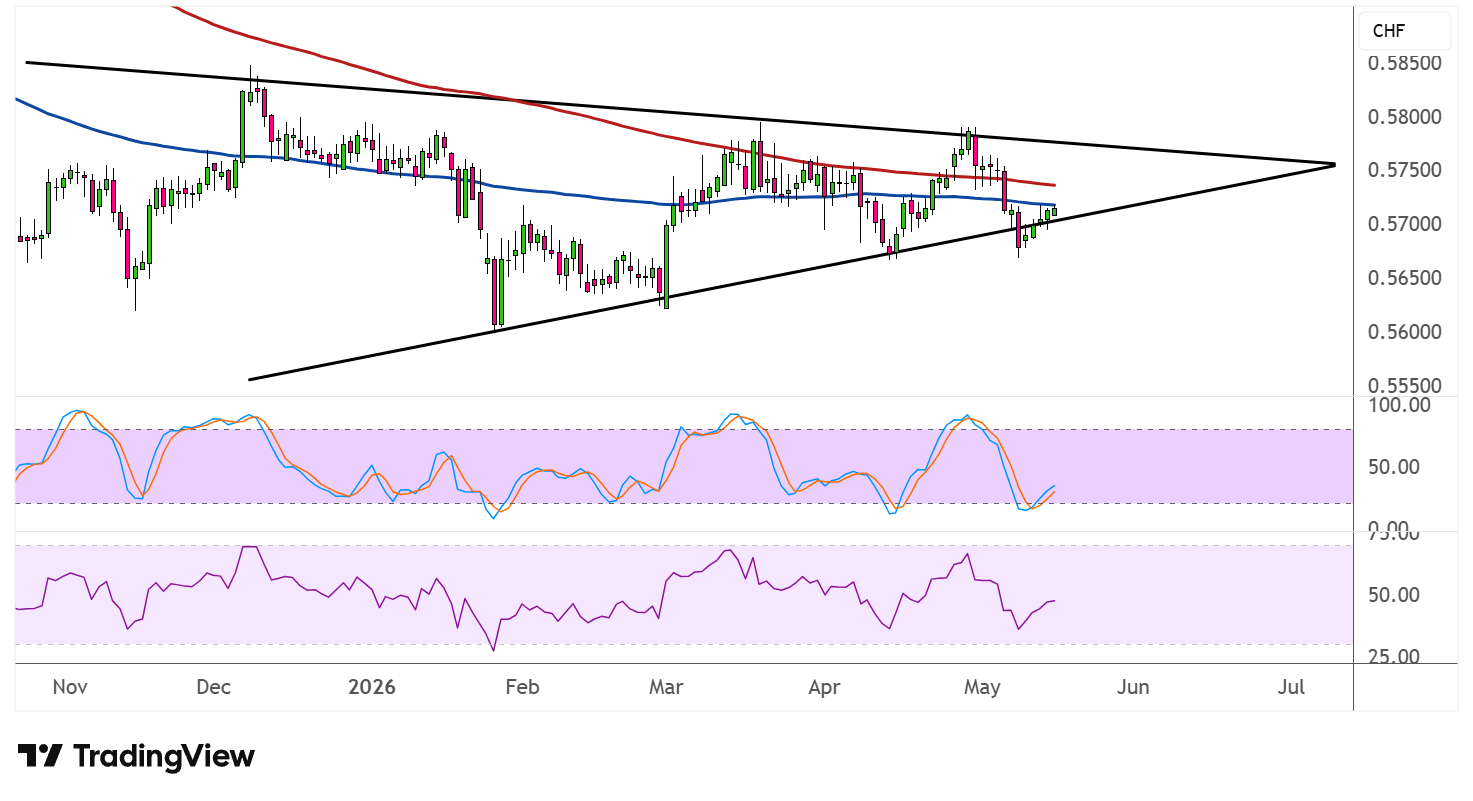
The 100 SMA is still below the 200 SMA to indicate that the path of least resistance is to the downside or that the longer-term bearish bias remains intact. Both moving averages are also sloping lower and converging with the upper triangle boundary, adding another layer of resistance that CADCHF would need to overcome for the bulls to regain control.
Stochastic has dipped close to the oversold area and appears to be turning higher, reflecting exhaustion among sellers and a potential return of buying interest. If the oscillator completes a bullish crossover from these levels, it could give the pair enough momentum to push back toward the triangle top.
RSI, meanwhile, has been hovering in the mid-range and has room to climb before reaching overbought territory, suggesting that buyers could still step in and push price higher while sellers take a breather.
A decisive breakout in either direction, accompanied by strong candlestick closes, would be the clearest signal of where CADCHF is headed next.



Comments
Log in or sign up to join the conversation.