

Hedging when the market is up is like buying an umbrella when it's sunny out: you'll be protected when it rains (Photo by Vivienne Gucwa).
Protecting A $500k Stock Portfolio With SPY
With the market up about 22% since December's nadir, some investors may have become complacent. For those who haven't, now may be a good time to hedge against the possibility that the climb since December has been a bear market rally.
Here's a simple way of protecting a stock portfolio against further market risk using optimal, or least expensive, puts on SPY. For the purposes of this example, I'll assume your portfolio is worth $500,000, that it's closely correlated with SPY, that you have enough diversification within it to protect against stock-specific risk, and that you can tolerate a decline of up to 20% over the next several months (if you have a smaller risk tolerance, you can use the same approach entering a smaller decline threshold).
Step 1
Divide $500,000 by the current price of SPY, which was $285.83 as of Monday's close, to get 1,749 (rounded).
Step 2
Scan for the optimal, or least expensive, puts to protect against a >20% decline in 1,749 shares of SPY over the next several months (screen captures below via the Portfolio Armor iPhone app).
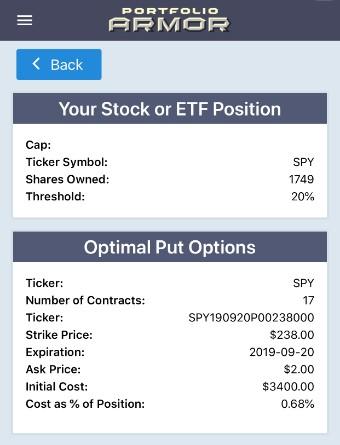
Note the cost here: $3,400, or 0.68% of portfolio value, which was calculated conservatively, using the asking price of the puts.
Step 3
Round up the number of SPY shares to the nearest 100 and repeat step 2.
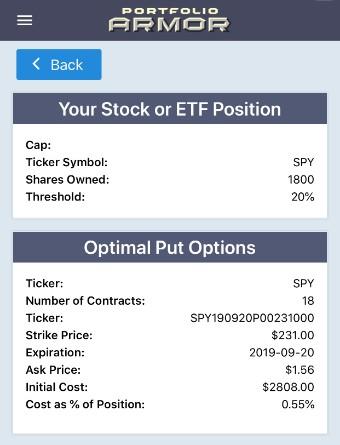
Note that, in this case, it's cheaper to hedge rounding up to the nearest round lot: The cost was $2,808, calculated conservatively, at the ask. That's about 0.56% of a $500,000 portfolio.
Continuing This Approach
If you hedge your portfolio this way and repeat the process before the hedge expires in September, you'll be protected against >20% declines during each time period, and your annual hedging cost will be about 1.16% (assuming, for the sake of simplicity here, that hedging costs are similar in September). So, if we don't slide into a bear market, you should generate a somewhat competitive return: Roughly, the market's return minus 1.16%.
A Potentially Market-Beating Approach
The approach above might beat the market over a time period that includes a severe decline, but it's not going to beat SPY in a bull market, because of the drag of hedging cost. To beat SPY while hedging in a bull market, you need to beat the market by enough with your underlying securities that your performance, net of your hedging cost, is still higher than the market. You're not going to do that with a diversified portfolio that's highly correlated to SPY. You need a different approach to have a shot at that.
One such different approach is the concentrated, hedged portfolios generated by Portfolio Armor. Since 2017, I've been creating these portfolios and tracking their performance in real time. Here's how the ones hedged against >20% declines have done so far (performance represents six-month periods starting on the starting date; click on a starting date to go to an interactive chart for that portfolio which shows its holdings.).
PORTFOLIOS HEDGED AGAINST > 20.0% DECLINES
| Starting Date | Expected Return | Actual Return | SPY Return |
|---|---|---|---|
| June 22, 2017 | 8.43% | 20.08% | 11.27% |
| August 31, 2017 | 8.03% | 9.10% | 10.87% |
| October 12, 2017 | 9.00% | 2.12% | 5.38% |
| October 19, 2017 | 10.07% | 13.05% | 6.08% |
| October 26, 2017 | 8.57% | 9.39% | 5.13% |
| November 2, 2017 | 9.77% | 10.67% | 3.11% |
| November 9, 2017 | 9.59% | 4.45% | 5.34% |
| November 16, 2017 | 8.95% | 5.18% | 6.22% |
| November 22, 2017 | 9.39% | 7.31% | 5.90% |
| November 30, 2017 | 8.55% | -4.74% | 3.80% |
| December 8, 2017 | 8.34% | 4.50% | 5.73% |
| December 14, 2017 | 7.75% | 17.49% | 5.87% |
| December 21, 2017 | 9.33% | 12.33% | 3.36% |
| December 28, 2017 | 9.92% | 9.45% | 1.99% |
| January 4, 2018 | 9.65% | 12.92% | 0.59% |
| January 11, 2018 | 8.93% | 9.14% | 1.12% |
| January 18, 2018 | 9.40% | 7.89% | 1.55% |
| January 25, 2018 | 9.82% | 6.19% | 1.10% |
| January 29, 2018 | 9.29% | 10.48% | -0.30% |
| February 1, 2018 | 9.00% | 0.84% | 0.59% |
| February 8, 2018 | 7.35% | 12.49% | 11.75% |
| February 15, 2018 | 8.19% | -6.14% | 4.08% |
| February 22, 2018 | 8.54% | 6.90% | 6.73% |
| March 1, 2018 | 7.98% | 6.66% | 9.37% |
| March 8, 2018 | 8.32% | -3.20% | 5.82% |
| March 15, 2018 | 7.90% | 2.50% | 6.68% |
| March 22, 2018 | 7.62% | 9.58% | 11.74% |
| March 22, 2018 | 7.65% | 8.82% | 11.74% |
| March 29, 2018 | 8.26% | 7.72% | 11.48% |
| April 5, 2018 | 10.59% | 0.20% | 9.33% |
| April 12, 2018 | 9.36% | 4.63% | 4.71% |
| April 19, 2018 | 11.04% | 17.36% | 3.67% |
| April 26, 2018 | 10.32% | 17.44% | 0.53% |
| May 3, 2018 | 10.08% | 7.54% | 4.47% |
| May 10, 2018 | 8.64% | 2.61% | 3.03% |
| May 17, 2018 | 11.53% | -4.37% | 1.54% |
| May 24, 2018 | 11.74% | -6.80% | -2.63% |
| May 31, 2018 | 7.76% | -4.70% | 2.66% |
| June 7, 2018 | 8.62% | -11.51% | -4.12% |
| June 14, 2018 | 13.05% | -9.78% | -5.71% |
| June 21, 2018 | 12.44% | -17.22% | -11.31% |
| June 28, 2018 | 11.80% | -7.95% | -7.58% |
| July 5, 2018 | 9.11% | -13.03% | -6.61% |
| July 12, 2018 | 9.97% | -8.37% | -6.32% |
| July 19, 2018 | 10.82% | -10.54% | -3.83% |
| July 26, 2018 | 9.87% | -6.70% | -5.21% |
| August 2, 2018 | 9.76% | -3.91% | -3.36% |
| August 9, 2018 | 12.78% | -1.44% | -4.12% |
| August 16, 2018 | 14.60% | 0.79% | -1.33% |
| August 23, 2018 | 15.20% | 0.71% | -1.30% |
| August 30, 2018 | 13.16% | -7.98% | -2.99% |
| September 6, 2018 | 13.66% | -4.72% | -2.75% |
| September 13, 2018 | 17.32% | -5.23% | -2.25% |
| September 20, 2018 | 13.73% | -0.28% | -2.66% |
| September 27, 2018 | 14.71% | -7.29% | -2.80% |
| Average | 10.10% | 2.41% | 2.13% |
One note about the table above: the current, wide gap between expected returns and actual returns is largely a function of a recent run of negative returns (since expected returns for portfolios are always positive). We expect that gap to close going forward.


Comments
Log in or sign up to join the conversation.