

With the release of personal income and sales figures today, we see the continued deceleration in economic activity continues, according to some key indicators noted by the NBER’s Business Cycle Dating Committee (BCDC).
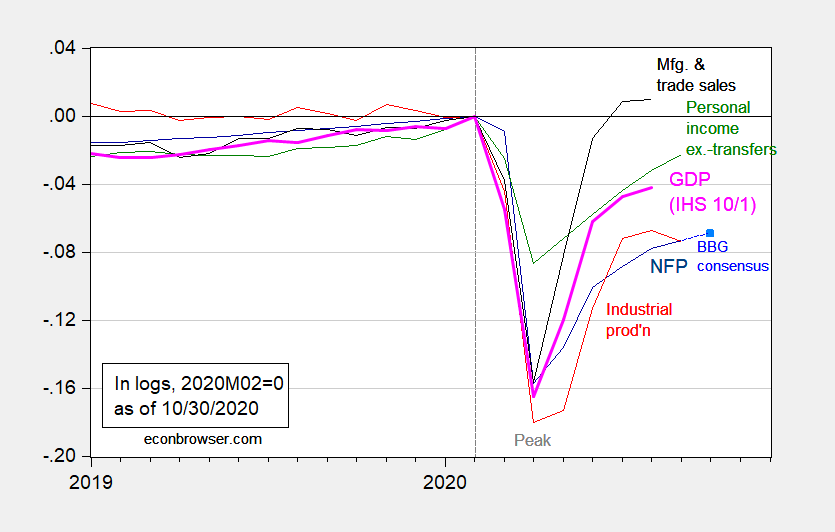
Figure 1: Nonfarm payroll employment (dark blue), Bloomberg consensus for October as of 10/30 (light blue square), industrial production (red), personal income excluding transfers in Ch.2012$ (green), manufacturing and trade sales in Ch.2012$ (black), and monthly GDP in Ch.2012$ (pink), all log normalized to 2020M02=0. NFP observation for October is based on Bloomberg consensus as of 10/30. Source: BLS, Federal Reserve, BEA, via FRED, Macroeconomic Advisers (10/1 release), NBER, Bloomberg, and author’s calculations.
Manufacturing and trade industry sales were essentially flat in August, while personal income ex.-transfers rose. That being said, real disposable personal income is down 8.7% relative to 2020M04 peak. Employment is slated to further decelerate, with the Bloomberg consensus increase at 600K, down from 850K two weeks ago.
A lot of the dynamics at the monthly frequency are obscured at the quarterly, which was discussed by Jim yesterday in “Record breaking in GDP”. For instance the partial snapback in Q3 is probably dissipated at M05. Hence, it might be of interest to consider how monthly GDP moves relative to quarterly explicitly. Unfortunately, IHS- Markit hasn’t released its September figure. I use reported July and August figures and actual BEA advance Q3 to infer the September value.
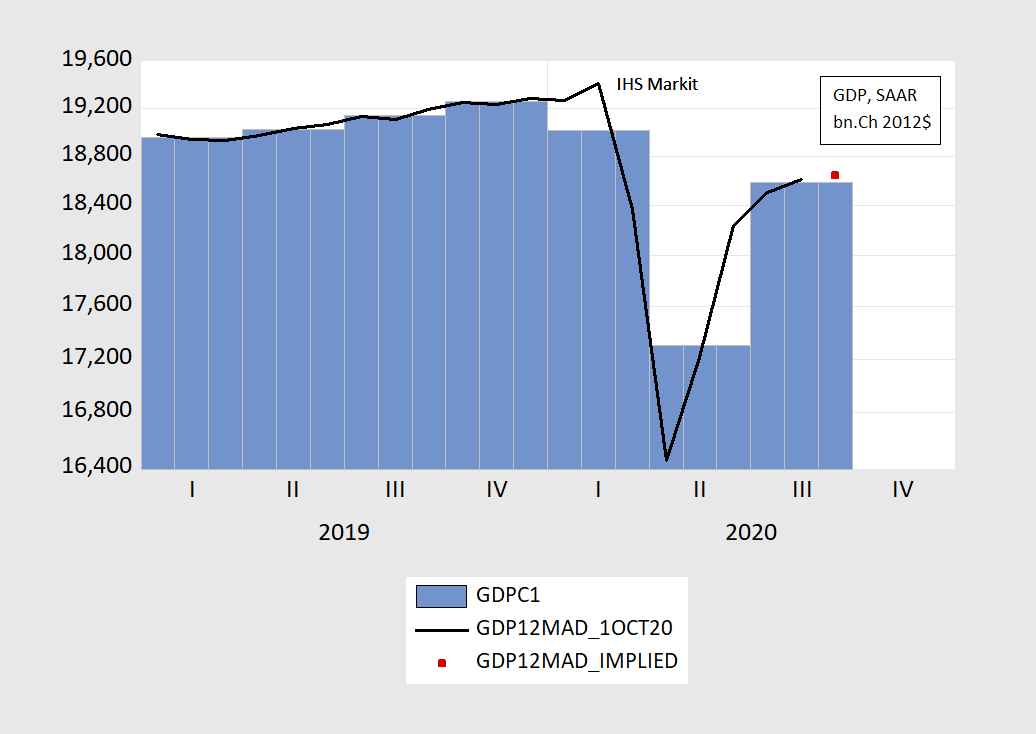
Figure 2: Quarterly GDP (blue bars), monthly GDP (black line), imputed September monthly GDP (red square), all in billions Ch.2012$ SAAR. Source: BEA 2020Q3 advance release, IHS Markit October 1 release, and author’s calculations.
Monthly GDP decelerates from 19% to 7% in July and August to (implied) 2% (SAAR) in September.
All this reinforces my view that — with no fiscal recovery package in sight and Covid-19 infections/hospitalizations surging — we are in for continued deceleration. The V ends here…unless and until a new competent administration is installed.


Comments
Log in or sign up to join the conversation.