

With the rebound in industrial production, and upward revisions in nonfarm payroll employment two weeks ago, key indicators look a little better than last post on this subject, a month ago.
(Click on image to enlarge)

Figure 1: Nonfarm payroll employment from August release (dark blue), industrial production (red), personal income excluding transfers in Ch.2012$ (green), manufacturing and trade sales in Ch.2012$ (black), consumption in Ch.2012$ (light blue), and monthly GDP in Ch.2012$ (pink), all log normalized to 2020M02=0. NBER defined recession dates shaded gray. Source: BLS, Federal Reserve, BEA, via FRED, IHS Markit (nee Macroeconomic Advisers) (11/1/2021 release), NBER, and author’s calculations.
There’s been some discussion of the upward revisions in nonfarm payroll employment over the summer (WaPo). This is definitely the case as shown in this post (graph below). However, the October shortfall relative to February 2020 is still 2.8% (in log terms).
(Click on image to enlarge)
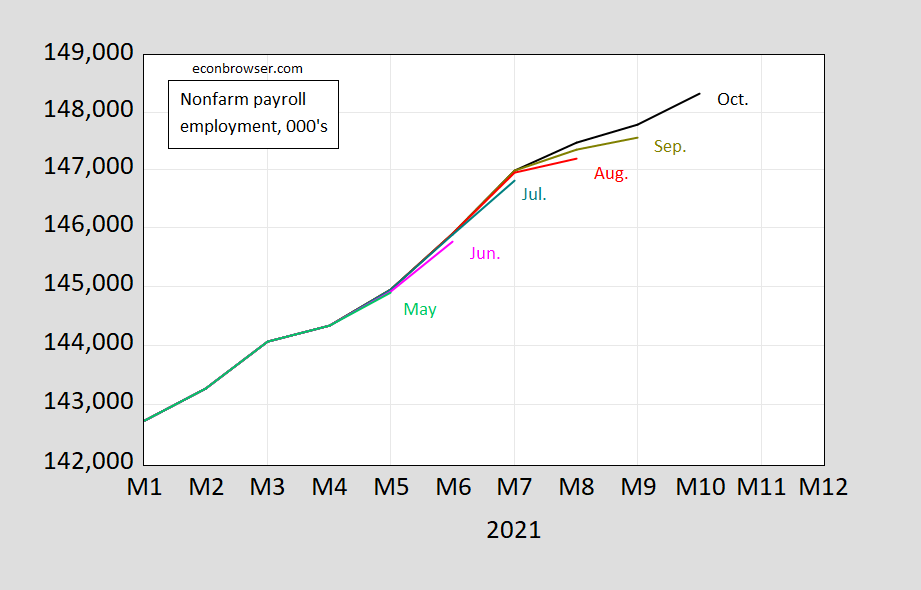
Figure 2: Nonfarm payroll employment in October (black), in September (chartreuse), August (red), July (teal), June (pink), May (light green), all in 000’s, s.a.Source: BLS.



Comments
Log in or sign up to join the conversation.