

Retail sales, industrial (but not manufacturing) production far above consensus.
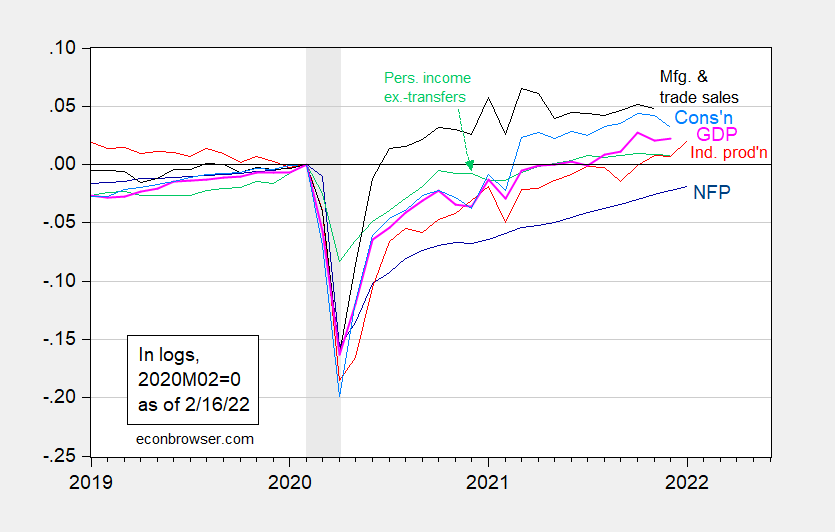
Figure 1: Nonfarm payroll employment (dark blue), industrial production (red), personal income excluding transfers in Ch.2012$ (green), manufacturing and trade sales in Ch.2012$ (black), consumption in Ch.2012$ (light blue), and monthly GDP in Ch.2012$ (pink), all log normalized to 2020M02=0. NBER defined recession dates, peak-to-trough, shaded gray. Source: BLS, Federal Reserve, BEA, via FRED, IHS Markit (nee Macroeconomic Advisers) (2/1/2022 release), NBER, and author’s calculations.
Retail sales is not in the graph above. However, to the extent there’s a rebound in retail sales, this is suggestive of maintained levels of manufacturing and trade sales (black line in Figure 1).
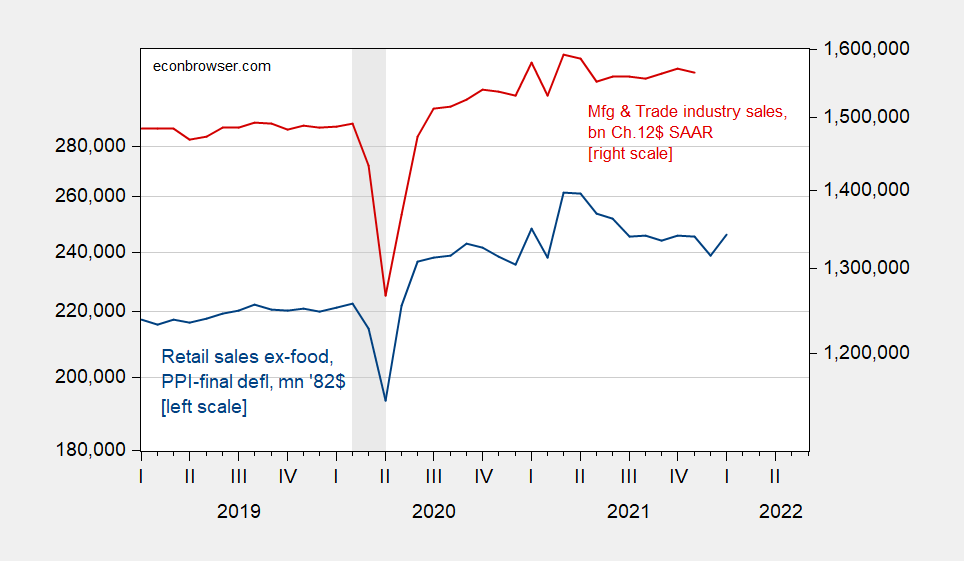
Figure 2: Retail sales ex-food services, mn 1982$ (blue, left log scale), and manufacturing and trade industry sales, in billions Ch.2012$, SAAR (red, right log scale). Retail sales deflated using PPI-finished goods. NBER defined recession peak-to-trough dates shaded gray. Source: Census via FRED, FRED, BLS, NBER, and author’s calculations.
A regression over the sample shown above yields (in first log differences) an adjusted-R2 of 0.81, a slope coefficient of 0.72.
Implied food services sales — the gap between FRED series RSAFS and RSXFS — declined in January, perhaps reflecting omicron’s impact.
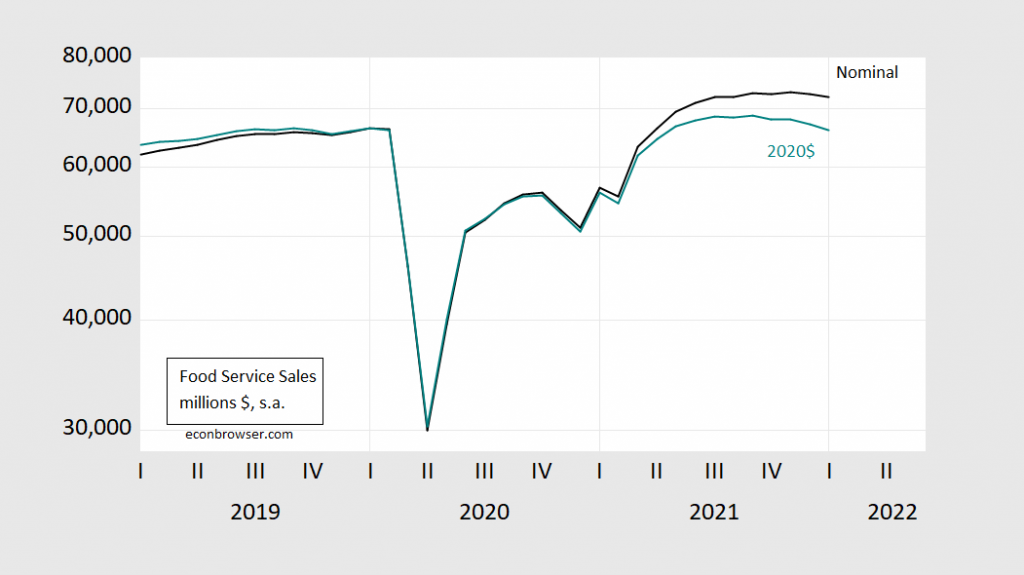
Figure 3: Food service sales, in millions $, s.a. (black), and in millions 2020$, s.a. (teal). Real series deflated using CPI. Source: Census, BLS via FRED and author’s calculations.
Adjusted for (CPI) inflation, the decline has been occurring for several months.


Comments
Log in or sign up to join the conversation.