

December industrial production (red line) adds to the (mixed) picture…
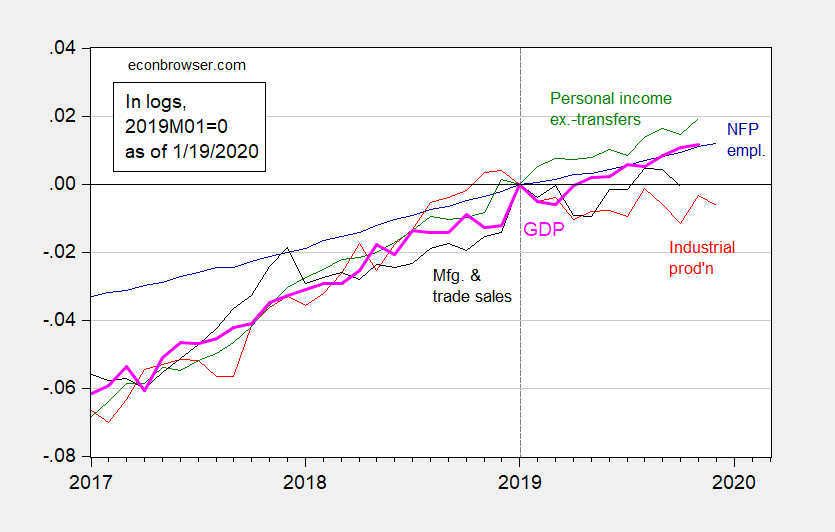
Figure 1: Nonfarm payroll employment (blue), industrial production (red), personal income excluding transfers in Ch.2012$ (green), manufacturing and trade sales in Ch.2012$ (black), and monthly GDP in Ch.2012$ (pink), all log normalized to 2019M01=0.Source: BLS, Federal Reserve, BEA, via FRED, Macroeconomic Advisers (12/30 release), and author’s calculations.
As noted previously, employment is likely to be revised downward, based on QCEW trends. I redraw the figure using this implied series.
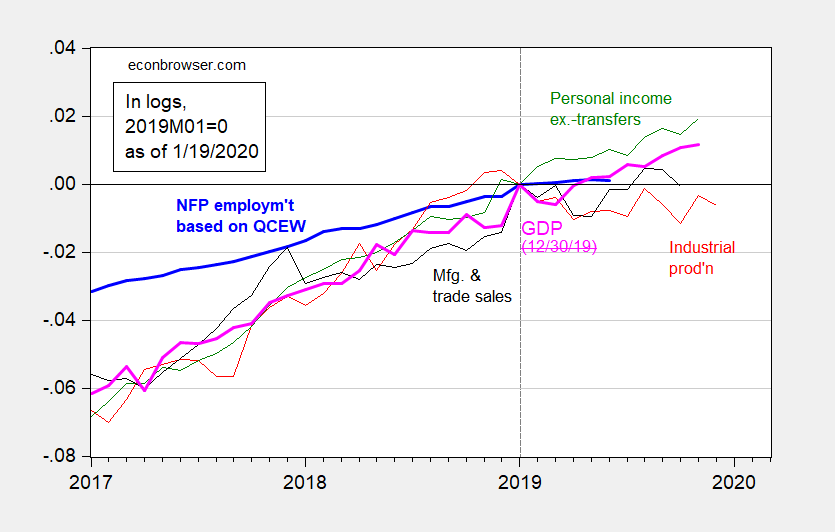
Figure 2: Nonfarm payroll employment implied by Quarterly Census of Employment and Wages (light bold blue), industrial production (red), personal income excluding transfers in Ch.2012$ (green), manufacturing and trade sales in Ch.2012$ (black), and monthly GDP in Ch.2012$ (pink), all log normalized to 2019M01=0.Source: BLS, Federal Reserve, BEA, via FRED, Macroeconomic Advisers (12/30 release), and author’s calculations.
With industrial production and employment trending sideways, it’s hard to argue that recession is upon us. One alarming indicator is freight.
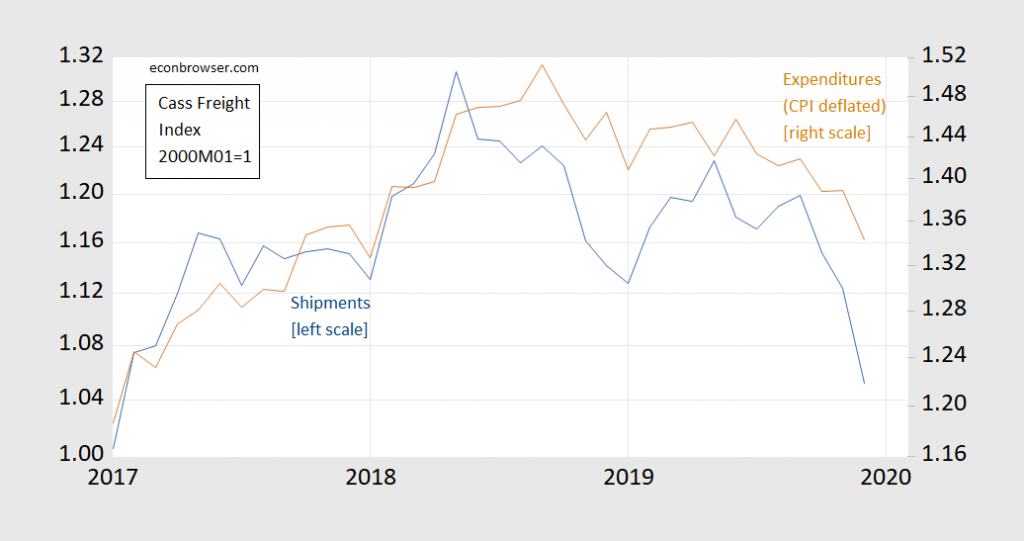
Figure 3: Cass Freight Index – Shipments (blue, left log scale); Expenditures deflated by CPI-all (brown, right log scale), both 2000M01=1. Source: Cass Information Systems, BLS via FRED, and author’s calculations.
(Click on image to enlarge)
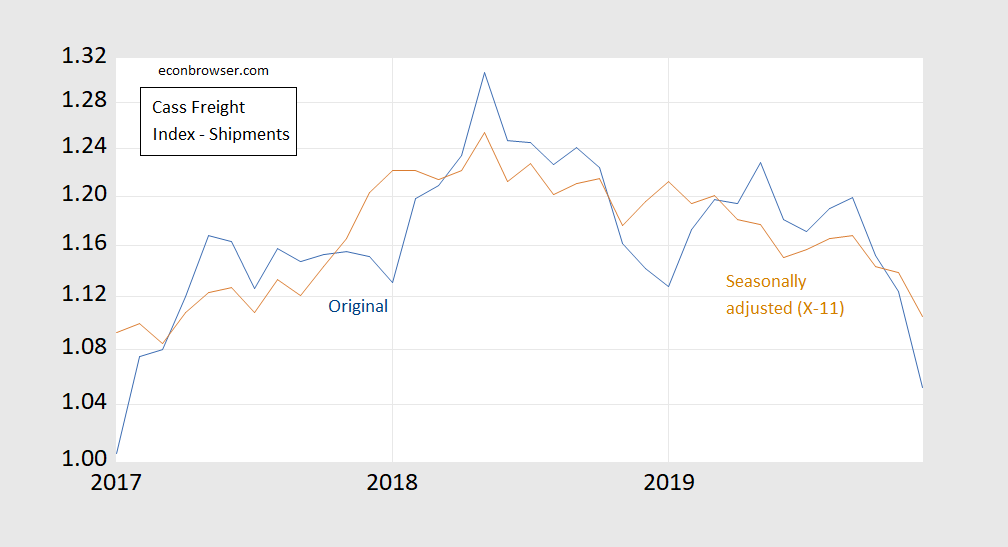
Figure 4: Cass Freight Index – Shipments (blue), and seasonally adjusted using Census X-11 (brown), both on log scale, 2000M01=1. Source: Cass Information System and author’s calculations.



Comments
Log in or sign up to join the conversation.