

The goods production side of the economy continues to recover, consumption jumps, while other indicators faltered. Some key indicators followed by the NBER Business Cycle Dating Committee.
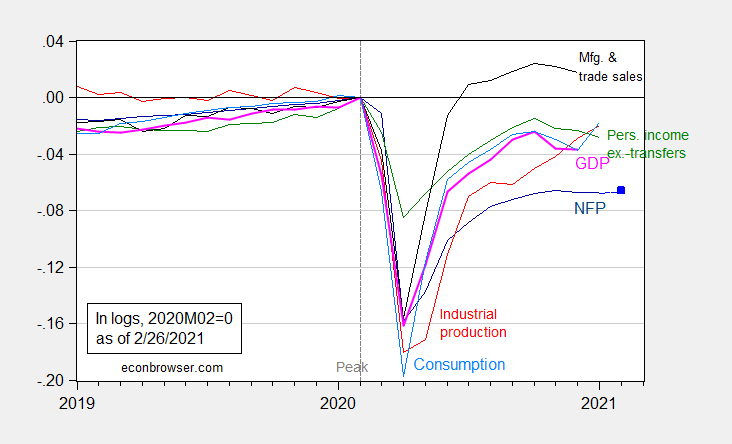
Figure 1: Nonfarm payroll employment (dark blue), Bloomberg consensus as of 2/26 for February nonfarm payroll employment (light blue square), industrial production (red),personal income excluding transfers in Ch.2012$ (green), manufacturing and trade sales in Ch.2012$ (black), consumption in Ch.2012$ (light blue), and monthly GDP in Ch.2012$ (pink), all log normalized to 2020M02=0. Source: BLS, Federal Reserve, BEA, via FRED, IHS Markit (nee Macroeconomic Advisers) (2/1/2021 release), NBER, and author’s calculations.
Manufacturing and trade industry sales data extends only through December; if retail sales are any guide, this series will recover with February’s data (there seems to be a lag, at least over the last two years).
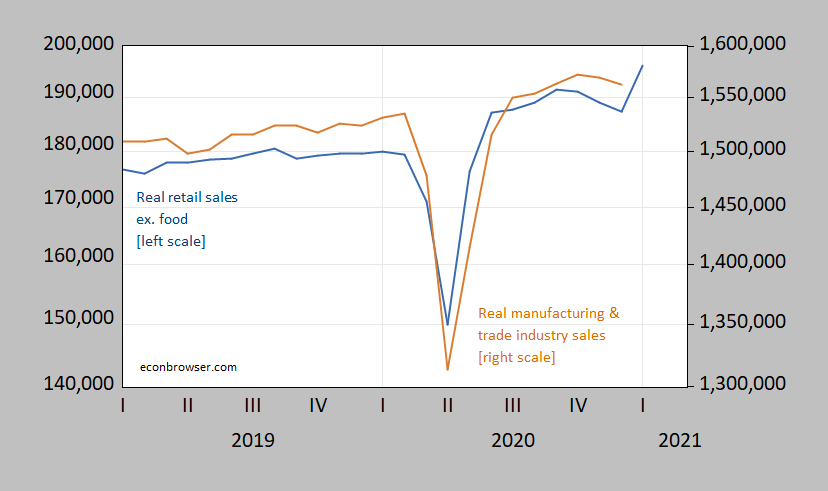
Figure 2: Retail sales ex.-food services, in 1982-84$ (blue, left log scale), and manufacturing and trade industry sales, in Ch.2012$ (brown, right log scale), both in millions of dollars, seasonally adjusted. Source: Census, BLS via FRED, author’s calculations.
As of today, Atlanta Fed, NY Fed, and IHS Markit have Q1 growth nowcasted at 8.8%, 8.7%, and 3.4% SAAR.



Comments
Log in or sign up to join the conversation.