
JAPANESE YEN TALKING POINTS
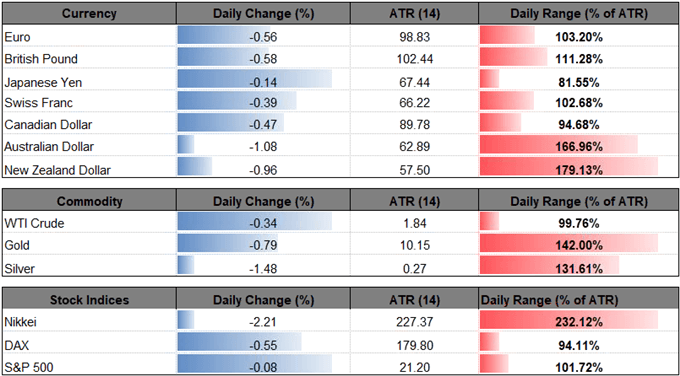
USD/JPY appears to be making another run at the March-high (111.40) as it extends the series of higher highs & lows from the previous week, but fresh developments coming out of the U.S. economy may curb the recent advance in the dollar-yen exchange rate as the data prints rattle expectations for four Fed rate-hikes in 2018.
BULLISH USD/JPY SEQUENCE KEEPS MARCH-HIGH ON RADAR

USD/JPY remains bid after failing to test the June-low (108.72) and recent price action keeps the topside targets on the radar as both price and the Relative Strength Index (RSI) continue to track the bullish trends from earlier this year.
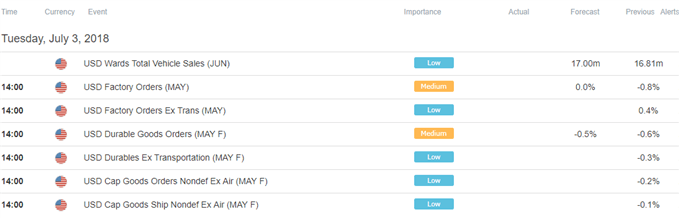
However, the limited reaction to the unexpected uptick in the ISM Manufacturing survey suggests dollar-yen remains vulnerable to key developments coming out of the U.S. economy as a deeper look at the updates showed the Employment component narrowing to 56.0 from 56.3 in May.
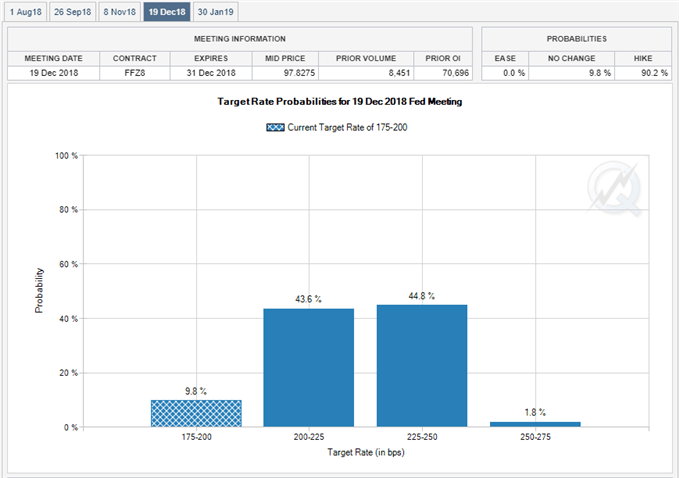
Seasonal trends may explain for the lackluster response as market participation tends to thin ahead of the major U.S. holiday, but it seems as though the data print has done little to sway the outlook for monetary policy as it dampens bets for an upbeat Non-Farm Payrolls (NFP) report. In turn, Fed Fund Futures may continue to highlight limited expectations for four rate-hikes, with the dollar-yen exchange rate at risk of facing headwinds over the coming days should the updates to the employment report dampen the outlook for growth and inflation.
USD/JPY DAILY CHART
(Click on image to enlarge)
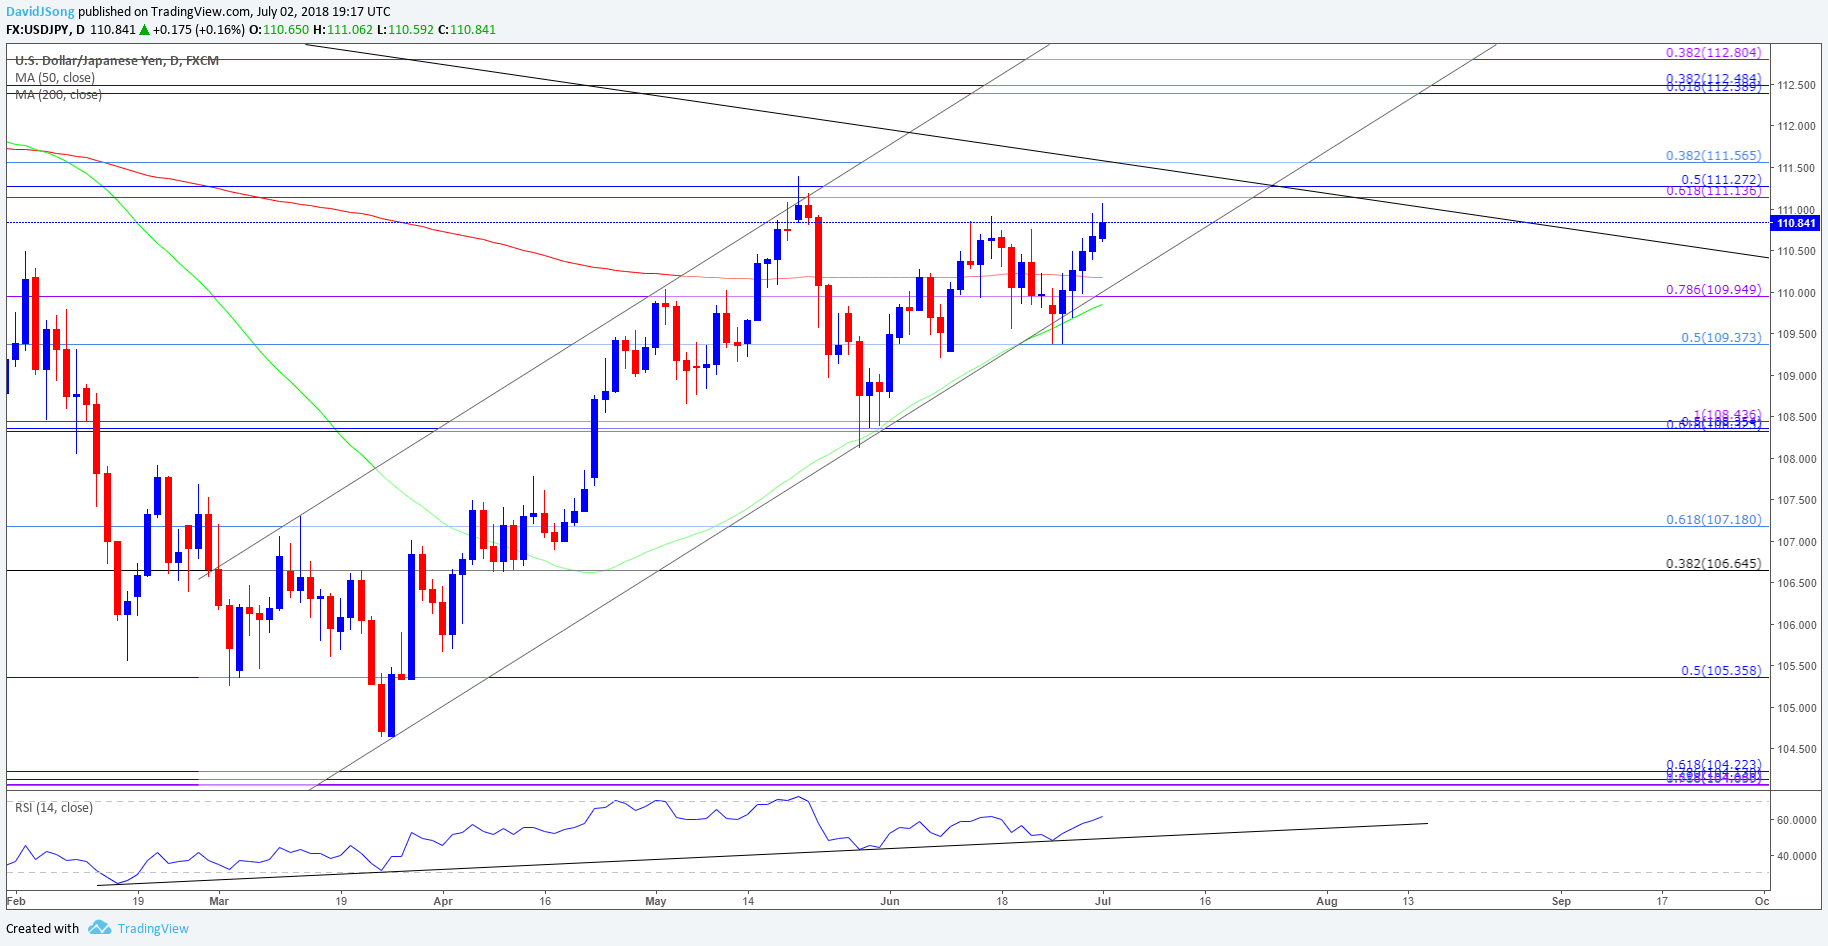
- Lack of momentum to break/close below the 109.40 (50% retracement) to 110.00 (78.6% expansion) region may foster a larger advance in USD/JPY, with the at risk of testing the March-high (111.40) as it extends the bullish sequence from the previous week.
- Need a break/close above the 111.10 (61.8% expansion) to 111.60 (38.2% retracement) region to open up the next topside hurdle around 112.40 (61.8% retracement) to 112.80 (38.2% expansion).


Comments
Log in or sign up to join the conversation.