

Recent developments in tech stocks pushed the Nasdaq 100 to fresh all-time highs while the broader market shows clear signs of weakness.
The main driver for the bullish over-performance of tech stocks comes from the "Big 5," with Microsoft, Apple, Amazon, Facebook and Google (Alphabet), which combined have around 20% of the total weight in the S&P500.
But, after recent developments like Amazon pushing above 3,000 USD and bringing the market capitalization to over 1.5 trillion USD and Apple's market capitalization pushing above 1.6 trillion USD, while most US companies lagging bullish momentum, the question arises: what happens if Amazon, Apple and Co. have one down-day?
What if the "Big 5" finally have a down day?
Last week the Nasdaq marked its second positive week in a row, third positive week in four, mainly driven by those "Big 5" which are also all listed in the broader SP500.
If we take out last Thursday's close, we saw Apple, Amazon, Microsoft, Facebook and Google experiencing a positive day while 392 stocks in the SP500 declined.
This massive divergence might not come as such a big surprise with latest developments around new Corona infections in the US, especially in Texas and Florida, states which combined are responsible for over 20% of the annual US GDP, leading to fears rising that another lockdown of the US economy could be imminent.
In addition to this, the Fed balance sheet kept on shrinking over the last week (the fourth weekly decline in a row), dropping below 7 trillion USD, indicating the biggest fall since May 2009.
While it is not just that the Fed reduced its asset purchase, but global central banks are paying down outstanding swaps and thus reducing liquidity which is desperately needed, particularly from Equity markets. This was certainly one of the main drivers for their performance over the last weeks and months and especially the fuel for the push higher in tech stocks.
And with the Citi's US economic surprise index surging to an All Time High and 10-year US yields show no inclination to rise, one can certainly see dark shadows at the horizon and a sharper drop in the "Big 5" and thus the Nasdaq100 seems likely.
But…
How can we trade [NQ100] in this environment?
First of all: formulating a short setup in this current, very bullish environment is risky and very speculative.
While there are clear signs of bullish exhaustion technically, for example with a bearish divergence forming on a daily time-frame in the RSI(14), this should only be viewed as an indication which makes long engagements a little more unattractive from a risk-reward perspective, not necessarily act as a short setup itself.
Still, one technique could be to scale into a trade, start with a small position if the [NQ100] CFD break below 10,500/520 points, placing a stop above 10,785 and aim for a re-test of the region around 10,150/200 points, delivering a risk-reward ratio of minimum 1 to 1.5:
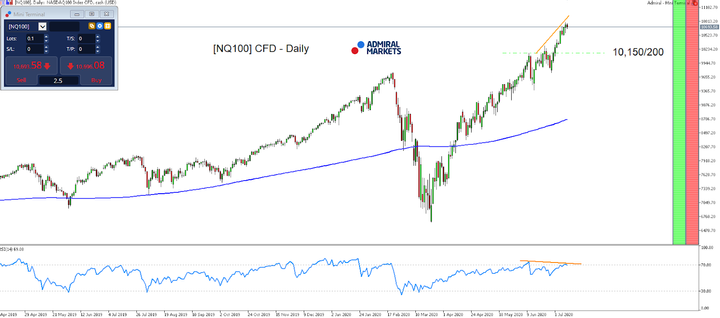
Source: Admiral Markets MT5 with MT5-SE Add-on [NQ100] CFD daily chart (between April 4, 2019, to July 10, 2020). Accessed: July 10, 2020, at 10:00pm GMT - Please note: Past performance is not a reliable indicator of future results, or future performance.
In 2015, the value of the NQ100 CFD increased by 7.8%, in 2016, it increased by 8.4%, in 2017, it increased by 30.5%, in 2018, it fell by 1.6%, in 2019, it increased by 39.7%, meaning that after five years, it was up by 108.5%.



Comments
Log in or sign up to join the conversation.