

Long before the June 5th, Friday "extraordinary" down day, we were preparing to identify “bull market reset patterns” that occur when leading sectors stumble.
As it turned out, the beginning of the reset wasn't hard to identify.
The market had one of the largest down days it has had in months.
The leading sector, semiconductors (SMH), led the move down.
The price action of the week created a “bearish key reversal” pattern in the SMH which led to key reversals in both the SPY and QQQ.
Last week's Market Outlook didn't call for a long-term top, but it did call for a “beginning of a new market environment.”
A Bull Market Reset
A bull market reset is a pause or a correction that offers enough rest to fuel a new leg up in the bull market. The reset can span days, weeks, or even months.
One of the healthy reset patterns is clear market rotation from the leading sectors into other sectors.
Another pattern in rotation within the leading sector from the hottest group of stocks into other areas within the sector.
Last week both patterns developed quickly.
There are several objective ways to measure or even scan for this rotation. Here are two simple examples:
Inside day pattern on days when the market closes clearly below its prior day low
Stocks trading over the high of the “key down day” high.
Look for these patterns in both the sector at the center of the bearish commentary (currently the SMH), and in other sectors that are candidates for demonstrating new market leadership (we’re looking at Industrials and financials).
The selling in SMH on the 5th was widespread, but the action on Monday was much more varied.
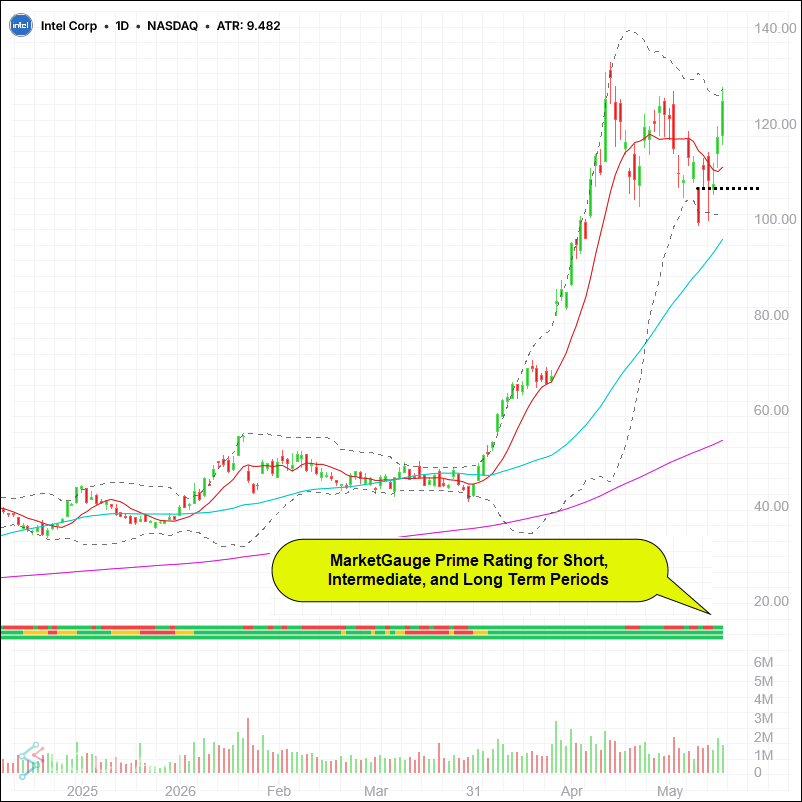
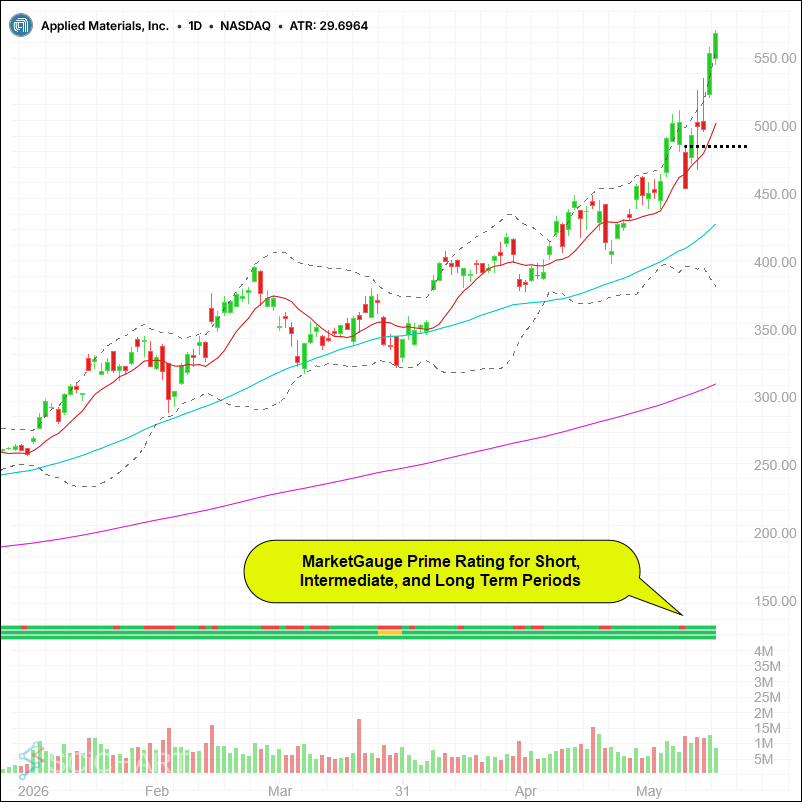
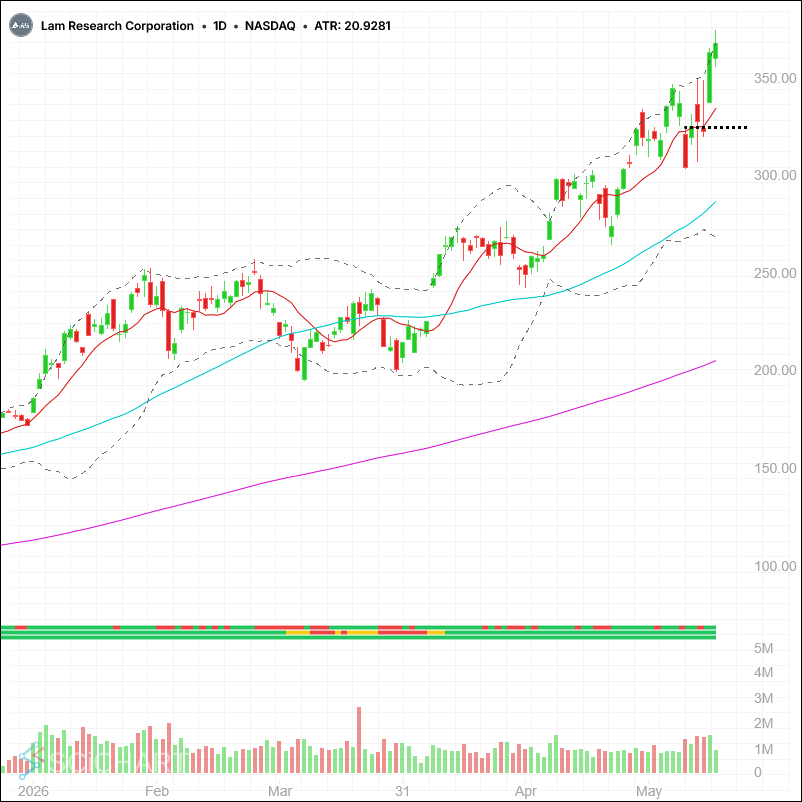
The examples below show semiconductor stocks that closed over the June 5th high on Monday, and not surprisingly, outperformed for the week and remain in desirable trend for anyone with a long position.
On the bearish day, the market was hinting at the fact that it was entering rotational correction as opposed to a more bearish broad selling top with the financials moving higher despite the extreme weakness in SMH.
The two financials below show patterns that are not perfect inside day patterns but did not trade below the prior day’s low on the 5th .
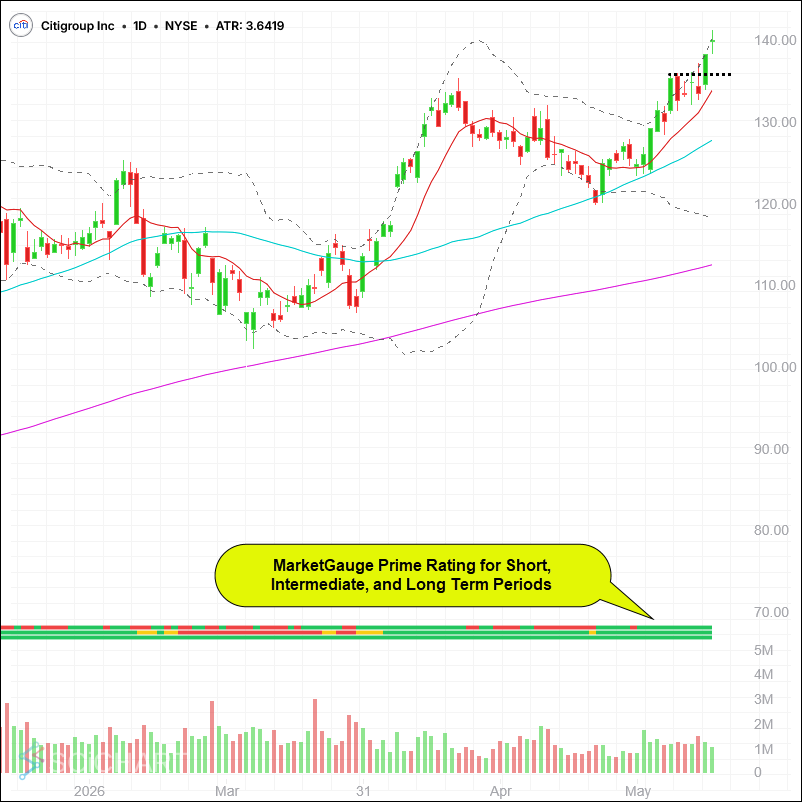
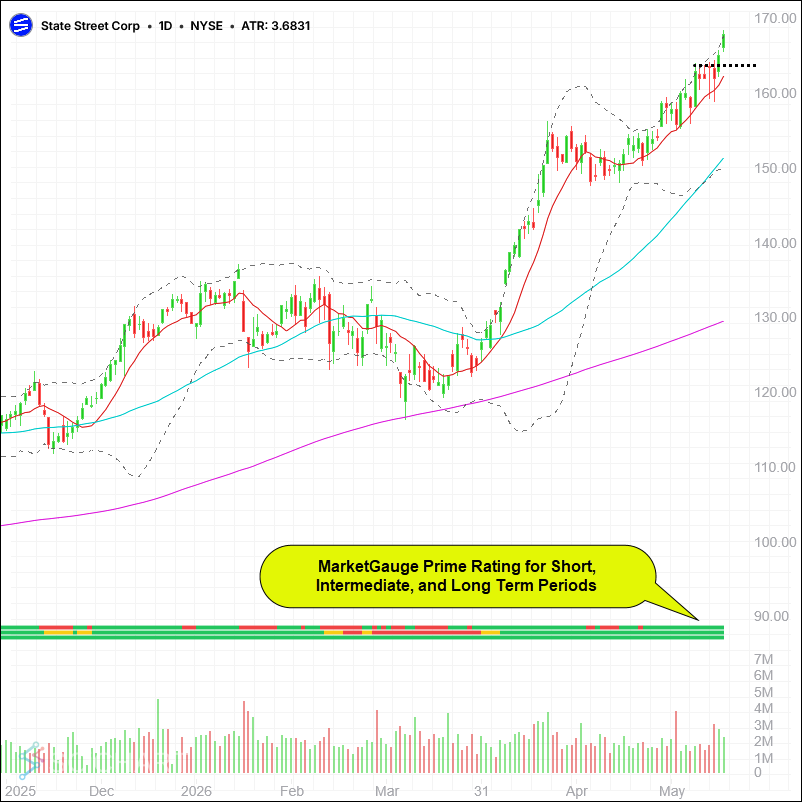
The analysis of both of these patterns is the same with Friday’s high labeled with the dotted line.
Look for the stocks to take out the high of the bearish day (Friday the 5th), and then move higher.
When this happens, you trades in leading stocks, and an indication that the general market is in a bullish reset pattern rather than a significant market top.
If you’re looking for trades, it’s also important to have the bigger trends in bullish conditions as we have indicated by the MarketGauge Prime Rating indicator. All of these examples where bullish on 3 time frame when the broke their dotted lines.
Sometimes Simple Is Better!


Comments
Log in or sign up to join the conversation.