
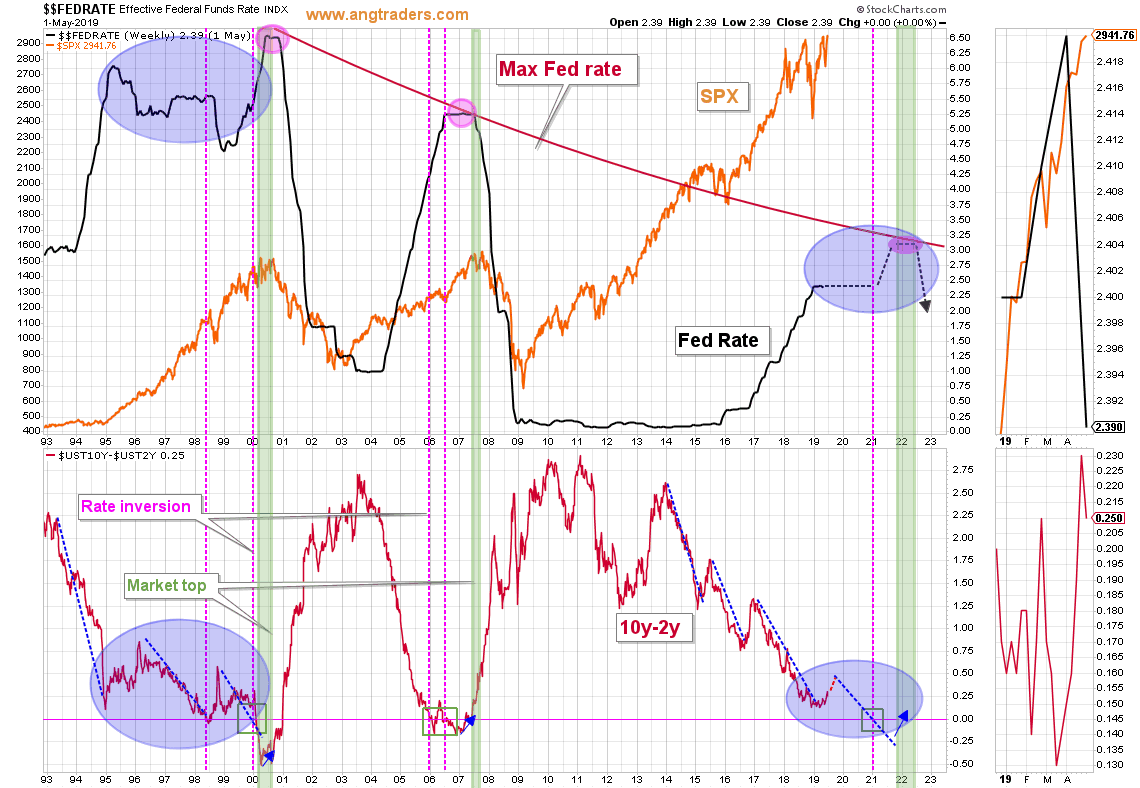
The most important rate differential is the 10y-2y rate, and this differential profile is increasingly similar to the pattern that started in 1995. That pattern coincided with the Fed holding the funds rate steady-to-lower for four years and with the SPX ripping higher the whole time. From this perspective, it would be reasonable to expect inversion of this rate pair in the middle of 2021 and the closest date for a recession would be 6-months later in 2022 (purple colored-areas in chart below).
The one fundamental indicator that had us concerned was the net yield of the SPX (dividend rate minus 6-month T rate), but we now see that it fits with the pattern from 1995-1999, just like the situation with the 10y-2y that is discussed above; the timing of recession (at the earliest) is 2022 from the perspective of this pattern as well (chart below).
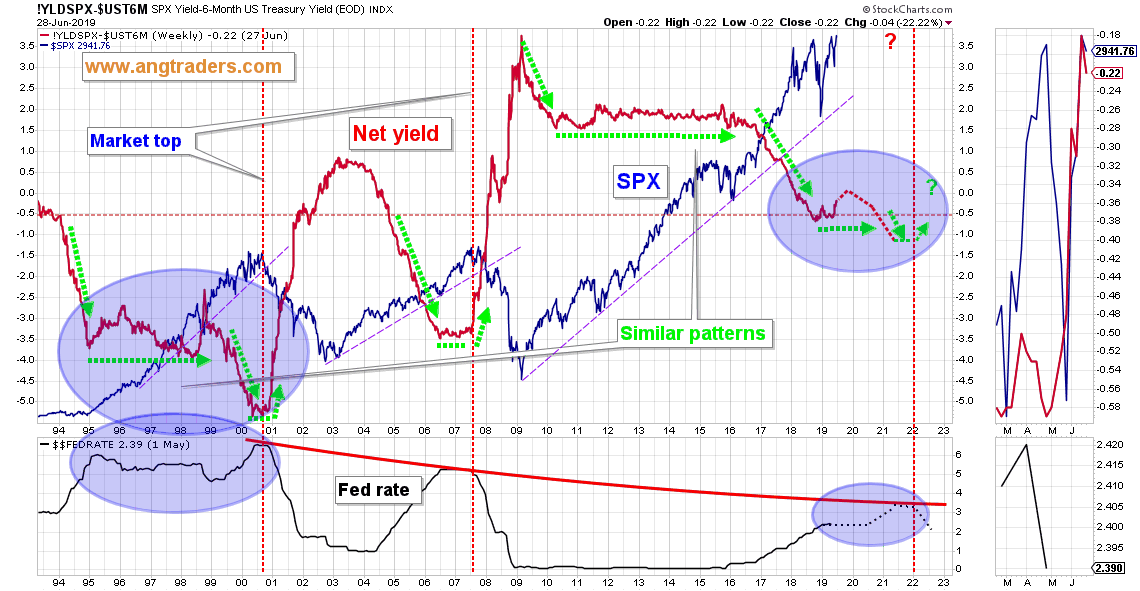
In summary: From the perspective of the Fed funds rate, rate differentials, and stock valuations the bull market should be in play until at least 2022.


Comments
Log in or sign up to join the conversation.