

Some price points lend themselves to potential turning points. Is the S&P at one of those price points? The inspector suggests it is!
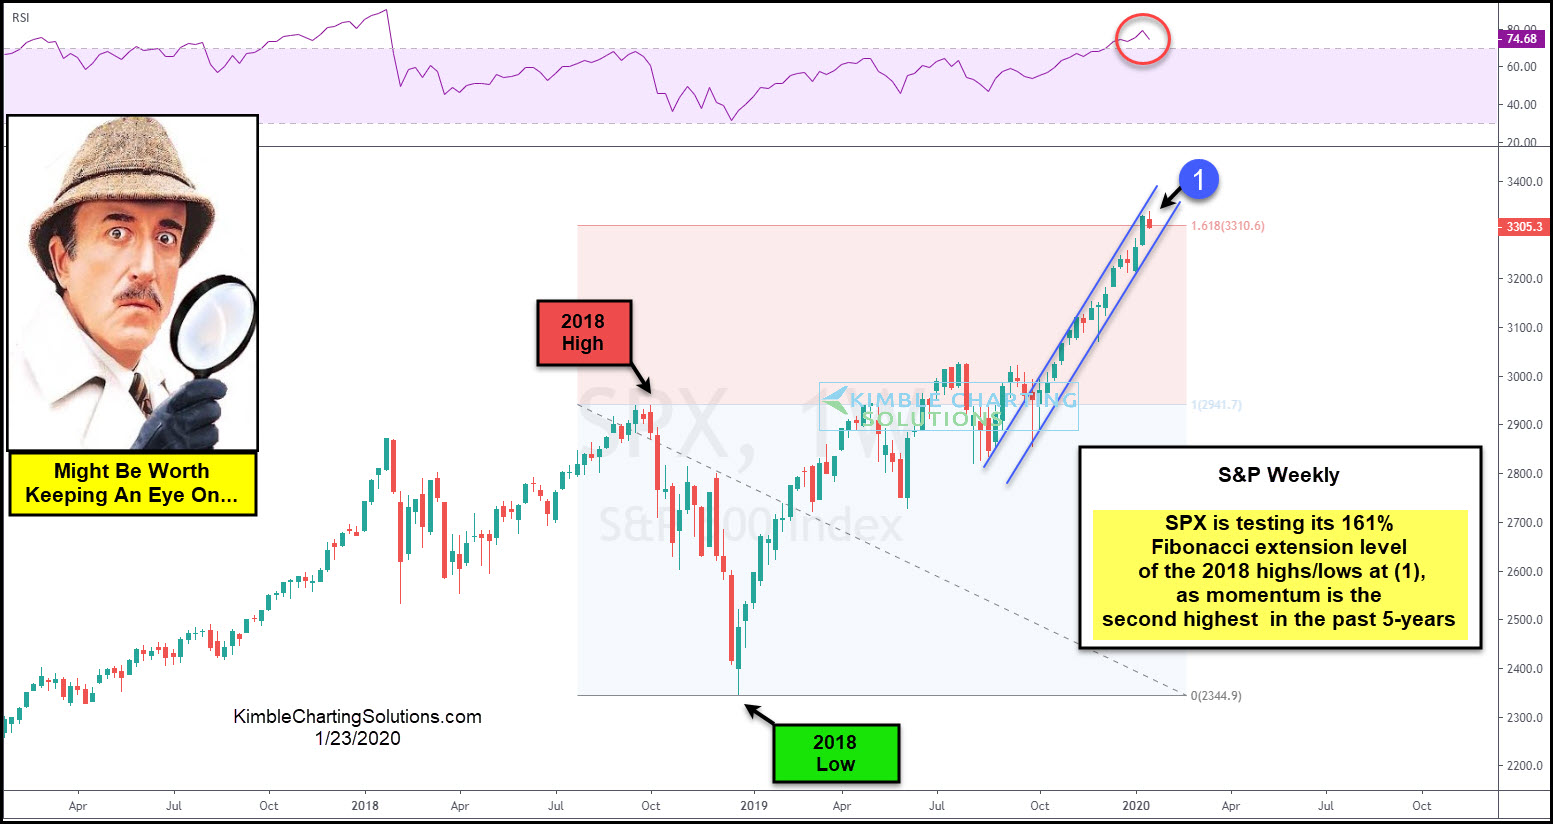
This chart looks at the S&P 500 over the past couple of years. Fibonacci was applied to the 2018 highs and 2018 lows.
The rally off the December 2018 lows, has the S&P testing its 161% extension level at (1).
While at this extension level, momentum is the 2nd highest in the past 5-years.
The Fibonacci extension level becomes a price point where some stock market bulls need/want to see a breakout. If accomplished, it sends them a strong bullish message.
Stock market bulls would receive a short-term concerning message should selling pressure or a reversal pattern take place, at this key Fibonacci extension level.



Comments
Log in or sign up to join the conversation.