

Bearish view
Sell the BTC/USD pair and set a take-profit at 62,000.
Add a stop-loss at 67,000.
Timeline: 1-2 days.
Bullish view
Buy the BTC/USD pair and set a take-profit at 67,000.
Add a stop-loss at 62,000.
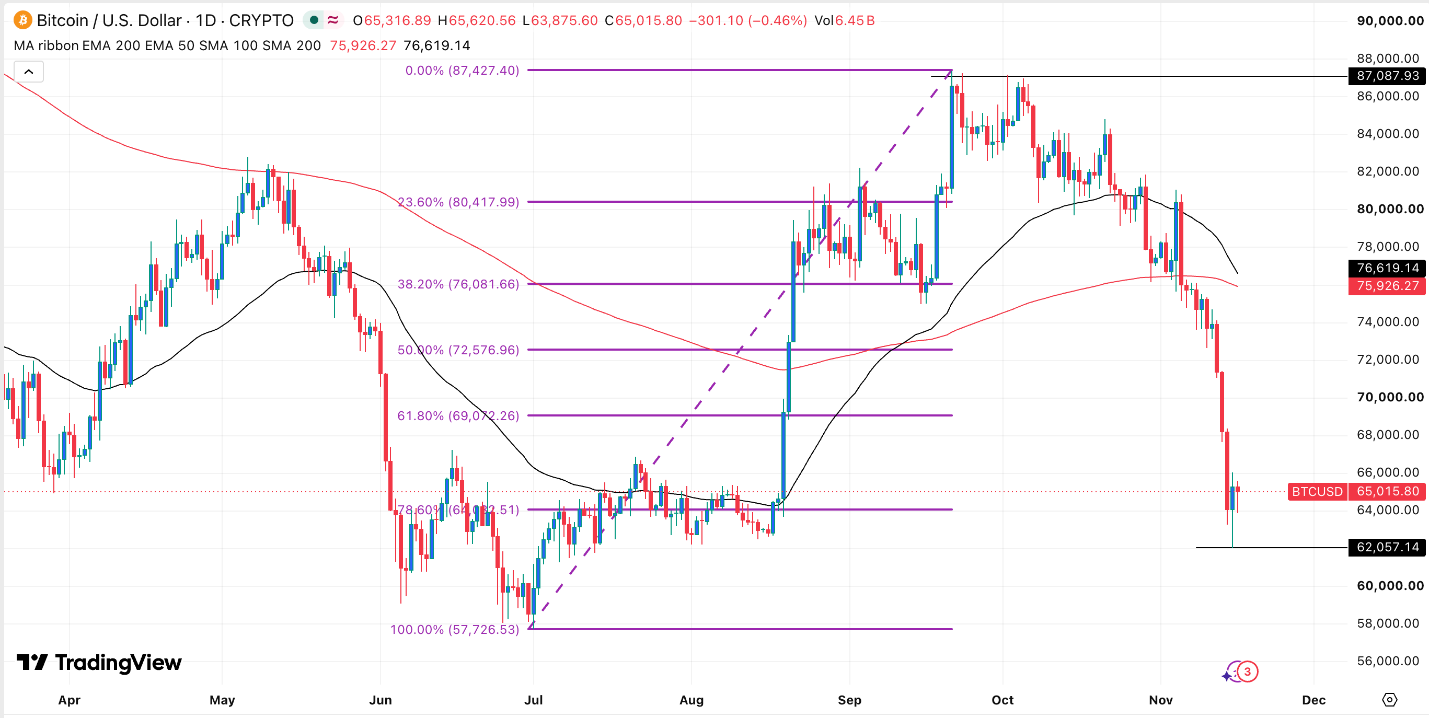
Bitcoin price remained under pressure this week and has formed a death cross pattern as concerns about demand continues. BTC/USD pair was trading at 65,000 on Tuesday, down sharply from the September high of 87,200.
Bitcoin Demand Continues Falling
There are signs that demand for Bitcoin continued waning in the spot, futures, and ETF market as risks in the industry jumped. Data shows that spot Bitcoin ETFs have shed over $1.6 billion this month, a sign that institutional investors expect it to drop further. The same has happened across other ETFs, including Solana, Ethereum, and XRP.
Further data shows that the futures open interest has continued falling in the past few months. It dropped to over $42 billion, down sharply from the year-to-date high of over $62 billion. That is a sign that demand among speculators has continued falling.
BTC/USD pair has also slumped because of the falling demand among investors in the spot market. Its 24-hour volume has dropped sharply in the past few months, which also explains why the Fear and Greed Index has moved to the extreme fear zone of 12. On the positive side, bull runs in the crypto industry tends to start whenever there is a lot of fear.
The fear has been driven by the recent Binance hack that cost it billions of dollars. Also, demand for Bitcoin has faded because of the midterm elections in which Democrats won by a large margin. There is also a possibility that the Federal Reserve will hike interest rates in the December meeting.
BTC/USD Technical Analysis
The daily chart shows that the BTC/USD pair has been in a strong sell-off in the past few months. It has plunged from a high of 87,200 to a low of 62,057. It then bounced back to over 65,000 today. A closer look shows that it formed a morning star candlestick pattern, which is a common bullish reversal pattern.
Bitcoin price has also dropped below the 61.8% Fibonacci Retracement level. It has slumped below the 50-day and 200-day moving averages and is about to form a death cross pattern. This pattern points to more downside over time.
Therefore, the coin will likely continue falling, potentially to this month’s low of 62,057. A move below that level will point to more downside, potentially to the support of 60,000.


Comments
Log in or sign up to join the conversation.