


Bullish view
Buy the BTC/USD pair and set a take-profit at 82,500.
Add a stop-loss at 75,000.
Timeline: 1-2 days.
Bearish view
Sell the BTC/USD pair and set a take-profit at 75,000.
Add a stop-loss at 82,500.
Bitcoin price remained under pressure this week as concerns about inflation continued amid the escalating situation in the Middle East. The BTC/USD pair fell to 78,490, a few points below this month’s high of 82,670.
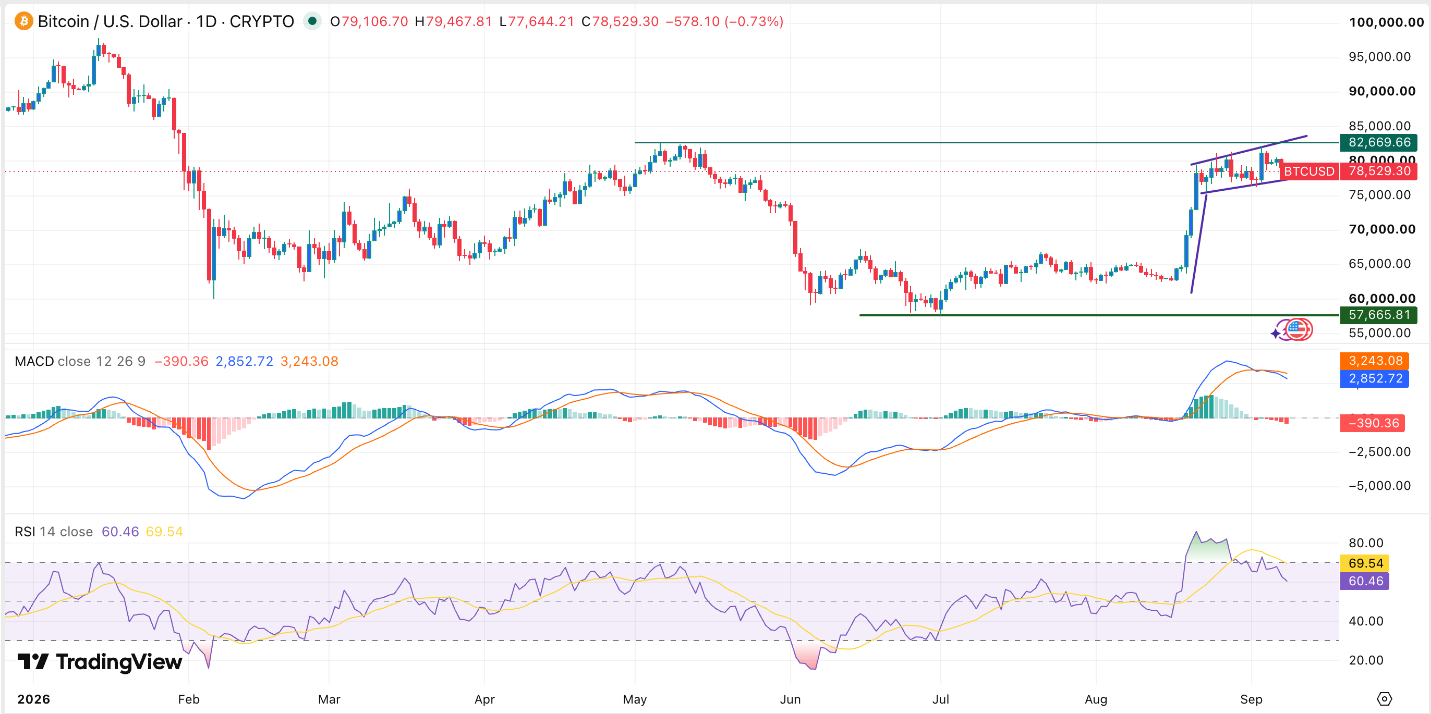
Bitcoin Price Wavers Amid Inflation Concerns
The BTC/USD pair pulled back as energy prices continued rising overnight. Brent, the global benchmark, crossed the important resistance level of $100 as the US and Iran exchanged fire. US launched attacks near Kharg Island, a move meant to push the Iranians to capitulate. Iran responded by striking US interests in the region.
The rising oil and gas prices raise the possibility that inflation will continue rising this year. A high inflation rate coupled with the recent strong jobs report means that the Federal Reserve will either hike interest rates or leave them at an elevated level. The bank has maintained rates unchanged between 3.50% and 3.75% this year.
This week’s inflation report will provide more hints on what to expect next week when the Fed meets next week. In a recent statement, Christopher Waller, a top Fed official, hinted that he will support hiking rates in this meeting if the upcoming inflation report is higher than expected.
Bitcoin’s weakness coincided with the performance of the stock market. The Dow Jones Index dropped by over 600 points, while the S&P 500 and Nasdaq 100 indices fell by 45 and 85 points, respectively.
BTC/USD Technical Analysis
Bitcoin has come under pressure this month, moving from this month’s high of $82,669 to the current $78,538. On the daily chart, the BTC/USD pair has formed an ascending channel and is now hovering near the lower side.
The Relative Strength Index (RSI) has moved from the overbought level of 80 to 60 and is pointing downwards. Similarly, the two lines of the MACD indicator have formed a bearish crossover.
Still, on the positive side, the BTC/USD pair has formed a bullish flag pattern, which is made up of a vertical line and a horizontal channel. Therefore, this pattern suggests that the pair may bounce back. This view will be confirmed if it moves above the upper side of the flag pattern at 82,670. A move above that level will point to more gains. On the other hand, oscillators suggest that the pair may drop to 70,000.



Comments
Log in or sign up to join the conversation.