

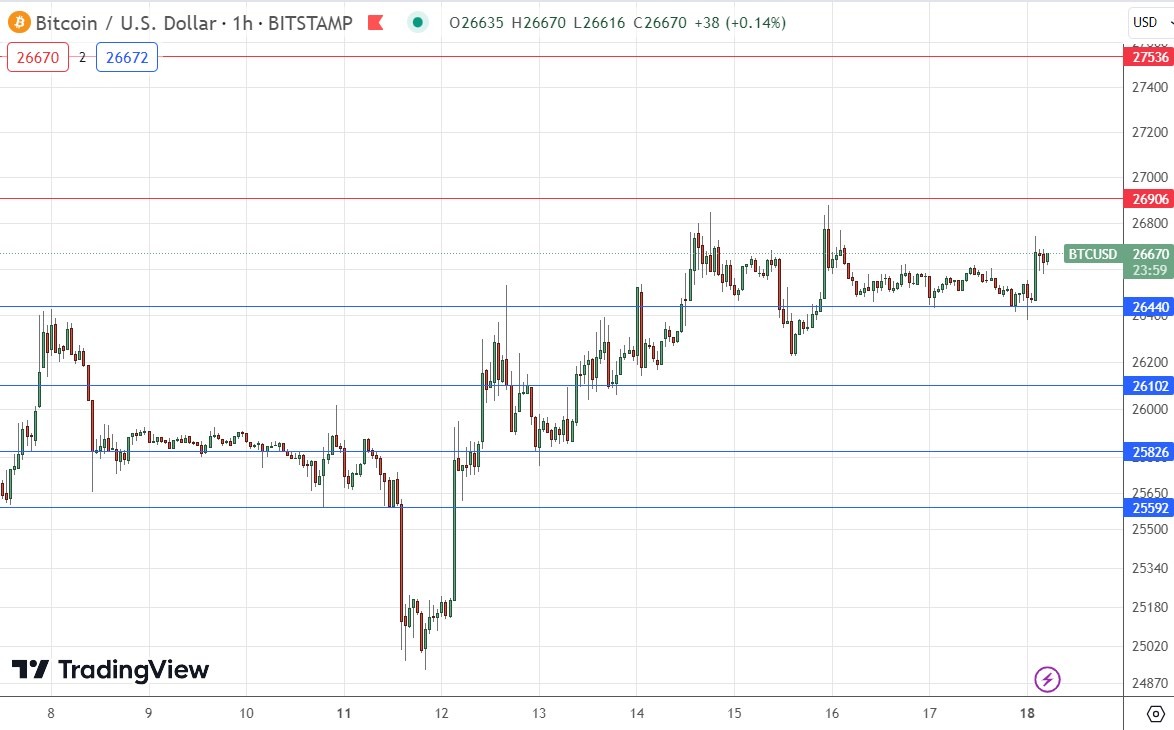
The price is now between key support at $26,440 which has held twice, and the nearest resistance level at $26,906 which is also confluent with a double top.
My previous BTC/USD signal on 13th September was not triggered as there was no bullish price action when the support level which I had identified at $24,612 was first reached.
Today’s BTC/USD Signals
Risk 0.75% per trade.
Trades must be taken prior to 5 pm Tokyo time on Tuesday.
Long Trade Ideas
- Go long after a bullish price action reversal on the H1 timeframe following the next touch of $26,440, $26,102, or $25,826.
- Place the stop loss $100 below the local swing low.
- Adjust the stop loss to break even once the trade is $100 in profit by price.
- Remove 50% of the position as profit when the trade is $100 in profit by price and leave the remainder of the position to run.
Short Trade Ideas
- Go short after a bearish price action reversal on the H1 timeframe following the next touch of $26,906 or $27,536.
- Place the stop loss $100 above the local swing high.
- Adjust the stop loss to break even once the trade is $100 in profit by price.
- Remove 50% of the position as profit when the trade is $100 in profit by price and leave the remainder of the position to run.
The best method to identify a classic “price action reversal” is for an hourly candle to close, such as a pin bar, a doji, an outside or even just an engulfing candle with a higher close. You can exploit these levels or zones by watching the price action that occurs at the given levels.
BTC/USD Analysis
I wrote in my previous BTC/USD analysis last week that if the price could get established below $25k it would be likely to fall further quite quickly. This was not tested, as the price has been rising weakly over the past few days.
The longer-term technical picture shows a bearish reversal following a climb to the $30k area some weeks ago. However, following that, the price has failed to get below $25k and is now rising after reaching close to that level. The rise is best categorized as weakly bullish, but it is bullish, and we see a clear sequence of higher lows over the past few days.
The price is now between key support at $26,440 which has held twice, and the nearest resistance level at $26,906 which is also confluent with a double top. This means that both levels look quite likely to be reliable, so there might be trade entry opportunities at either one if a test produces a rejection. However, as the dominant trend is weakly bullish, a long trade at $26,440 will probably be the best set-up that we might get.
(Click on image to enlarge)
More By This Author:
GBP/USD Forex Signal: Bears Prevail Ahead Of Fed, BoE Rate DecisionsForex Today: Fed, Bank Of Japan Expected To Hold Rates This Week
AUD/USD Forex Signal: Weak Recovery Continues

Comments
Log in or sign up to join the conversation.