

Alternatively, a bullish retracement to a resistance level followed by a reversal could also be a good opportunity to enter a short trade.
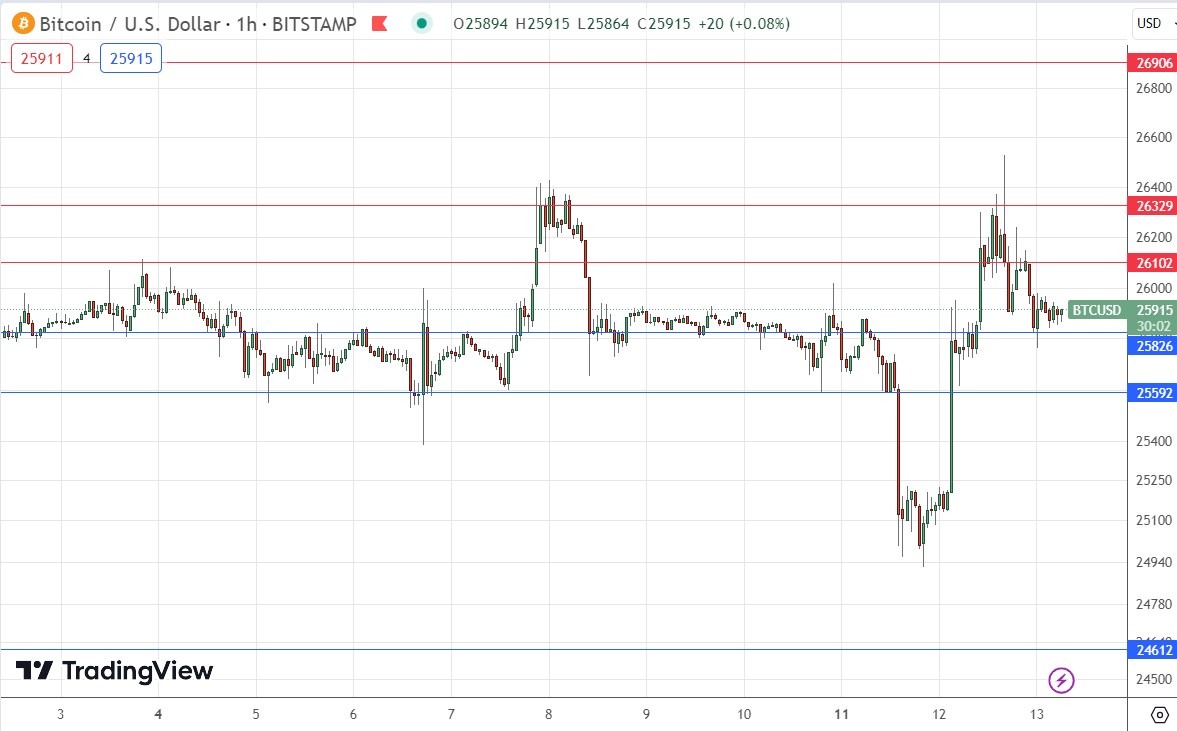
My previous BTC/USD signal on 6th September was not triggered as there was no bullish price action when the support level which I had identified at $24,612 was first reached.
Today’s BTC/USD Signals
Risk 0.75% per trade.
Trades may only be entered before 5pm Tokyo time Thursday.
Long Trade Ideas
- Long entry after a bullish price action reversal on the H1 timeframe following the next touch of $25,826 or $25,592.
- Put the stop loss $100 below the local swing low.
- Move the stop loss to break even once the trade is $100 in profit by price.
- Take off 50% of the position as profit when the trade is $100 in profit by price and leave the remainder of the position to ride.
Short Trade Ideas
- Short entry after a bearish price action reversal on the H1 timeframe following the next touch of $26,102 or $26,329.
- Put the stop loss $100 above the local swing high.
- Move the stop loss to break even once the trade is $100 in profit by price.
- Take off 50% of the position as profit when the trade is $100 in profit by price and leave the remainder of the position to ride.
The best method to identify a classic “price action reversal” is for an hourly candle to close, such as a pin bar, a doji, an outside or even just an engulfing candle with a higher close. You can exploit these levels or zones by watching the price action that occurs at the given levels.
BTC/USD Analysis
I wrote in my previous BTC/USD analysis that Bitcoin remained weak, but as the price had reached a zone of comfort, I expected sideways trading today with a minor bearish bias.
This was a fairly good call as this is what we have had here ever since.
The technical picture is generally bearish. By zooming out and looking at a long-term price chart, we can see that Bitcoin particularly and crypto in general have been in a bear market for some time.
The most interesting feature technically is what seems to be the significance and increasing fragility of the supportive floor which starts at about $25,592 although I will pay more attention to the big round number at $25k as a pivotal point – note in the price chart below that when the price last made a trip to that area, it bounced back quickly.
If the price can get established below $25k it will be likely to fall further quite quickly, so I will be prepared to enter a short trade if we get two consecutive hourly closes below $25k later. With the US Dollar threatening to renew its upwards movement if US inflation data due later today is higher than expected, this might work out to be a good trade later today after the data release.
Alternatively, a bullish retracement to a resistance level followed by a reversal could also be a good opportunity to enter a short trade.
I will not take any long trades today here.
I have identified a support level at $25,826 but I would be very wary of this – it looks like it is likely to not be very reliable.
(Click on image to enlarge)
More By This Author:
GBP/USD Technical Analysis: Bears’ Control Gets StrongerGold Technical Analysis: Gold Is Headed For New Buy Levels
Forex Signal: Euro Is At Risk as Oil Jumps Ahead Of US CPI Data

Comments
Log in or sign up to join the conversation.