
Bearish view
Sell the BTC/USD pair and set a take-profit at 60,190.
Add a stop-loss at 70,000.
Timeline: 1-2 days.
Bullish view
Buy the BTC/USD pair and set a take-profit at 70,000.
Add a stop-loss at 60,000.
Bitcoin price remains in a steep bear market this week as investors continued to dump it and moving to the booming stock market. The BTC/USD pair crashed below the key support level at 63,000 for the first time since April 2nd.
Bitcoin Price Crashes Amid Increasing Outflows
The BTC/USD pair retreated sharply, moving from a high of 82,650 in April to the current 66,000. This crash happened as investors continued selling their ETF holdings. Data shows that in the first three trading days of the month, these funds have shed over $1 billion. This is a substantial amount since these funds shed over $2.4 billion in assets last month.
These funds have had a cumulative net inflows of $54 billion and hold $85 billion in assets under management (AUM). In contrast, the stock market is booming, with ETF inflows continuing rising. Vanguard’s S&P 500 Index ETF (VOO) crossed the $1 trillion assets for the fist time ever.
This performance is happening because of the ongoing artificial boom that has pushed most stocks higher. The S&P 500 and Nasdaq 100 indices have jumped to record highs.
Bitcoin also retreated after the US published strong macro data. According to the Bureau of Labor Statistics (BLS), the economy added over 122k jobs last month, higher than the median estimate of 118k. These numbers mean that the Federal Reserve may maintain a hawkish tone.
The BTC/USD pair continued falling as the futures open interest plunged and bullish liquidations jumped. Bitcoin positions worth over $1 billion have been liquidated this week and this trend may continue in the near term.
BTC/USD Technical Analysis
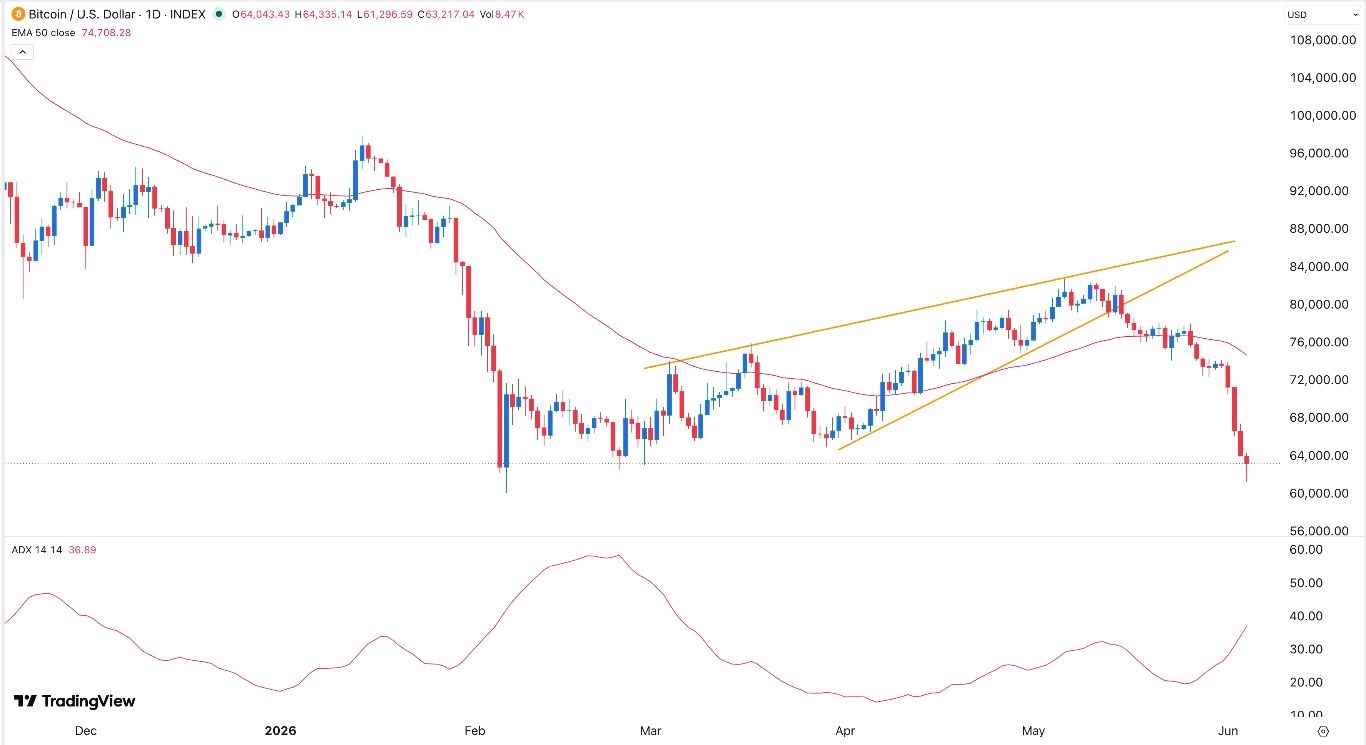
Technical analysis suggests that the BTC/USD pair has more downside to go this year. It formed a rising wedge pattern between February and May this year. This pattern is made up of two ascending and converging trendlines.
The pair has constantly remained below the 200-day Exponential Moving Average (EMA) this year. It has also recently retreated below the 50-day moving average and the Supertrend indicator.
The Average Directional Index (ADX) has jumped to 33.70, its highest point since March 8 this year. A soaring ADX figure is a sign that the bearish momentum is accelerating.
Therefore, the most likely scenario is where the BTC/USD pair continues falling, potentially to the year-to-date low of 60,190. A break below that level points to more downside to 50,000.
Comments
Log in or sign up to join the conversation.