
(Click on image to enlarge)

Source: BTC/USD Admiral Markets MT5 with MT5SE Add-on - Accessed: 09.10.2018 01:13 AM
(Click on image to enlarge)

Source: BTC/USD Admiral Markets MT5 with MT5SE Add-on - Accessed: 09.10.2018 01:13 AM
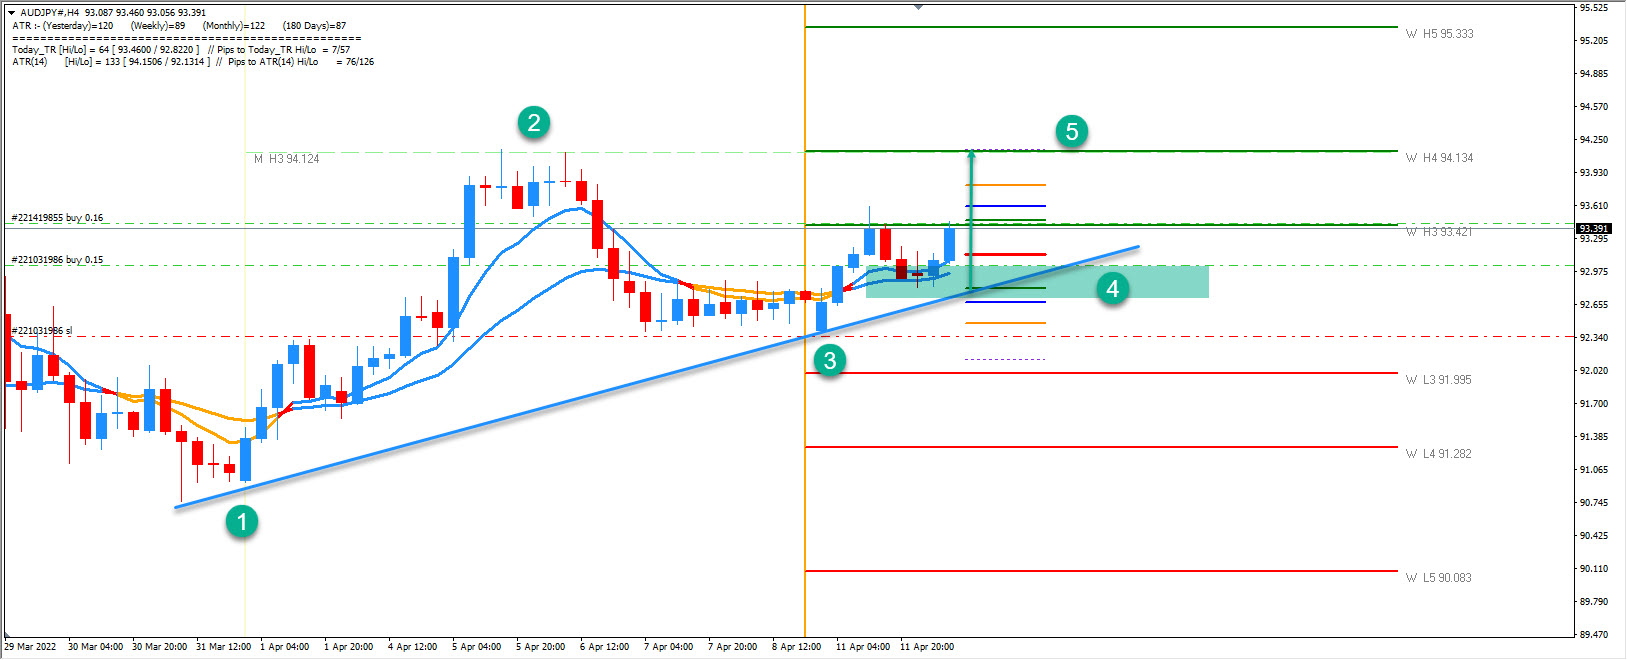
The BTC/USD Cryptocurrency pair has formed a bullish pennant pattern just above the PP point and close to the R1 resistance. It means that we might expect a potential breakout of the R1 pivot towards R2 and R3. Tomorrow, we might see a slower day as there are no major USD data news updates on the schedule.
Technically, the BTC/USD cryptocurrency pair might exhibit a higher volatility, if the price closes above the upper trend line of this emerging pattern. A close above 6636 should target 6752 and 6888. If we compare higher highs and higher lows of the bullish pennant, we can easily see a constricting price action that might explode. Only a close below the S1 pivot might give bears additional momentum for a further drop. Always pay attention to price action before you start making new entries, as consolidation usually precedes breakouts.
Pivot Lines - Weekly Support and Resistance
POC - POC - Point Of Confluence (The zone where we expect the price to react - aka the entry zone)

Comments
Log in or sign up to join the conversation.