


In this technical blog, we’ll take a quick look at the latest Elliott Wave analysis for BTCUSD. Bitcoin has been showing clear bullish impulsive sequences from the August 1 low. The strongest part of the rally was labeled as wave ((iii)) of 3, which is a textbook example of the powerful momentum usually seen during the third wave of an Elliott Wave impulse.
In the analysis below, we’ll discuss the short-term Bitcoin outlook, possible scenarios, and the key technical levels that could determine BTCUSD’s next move.
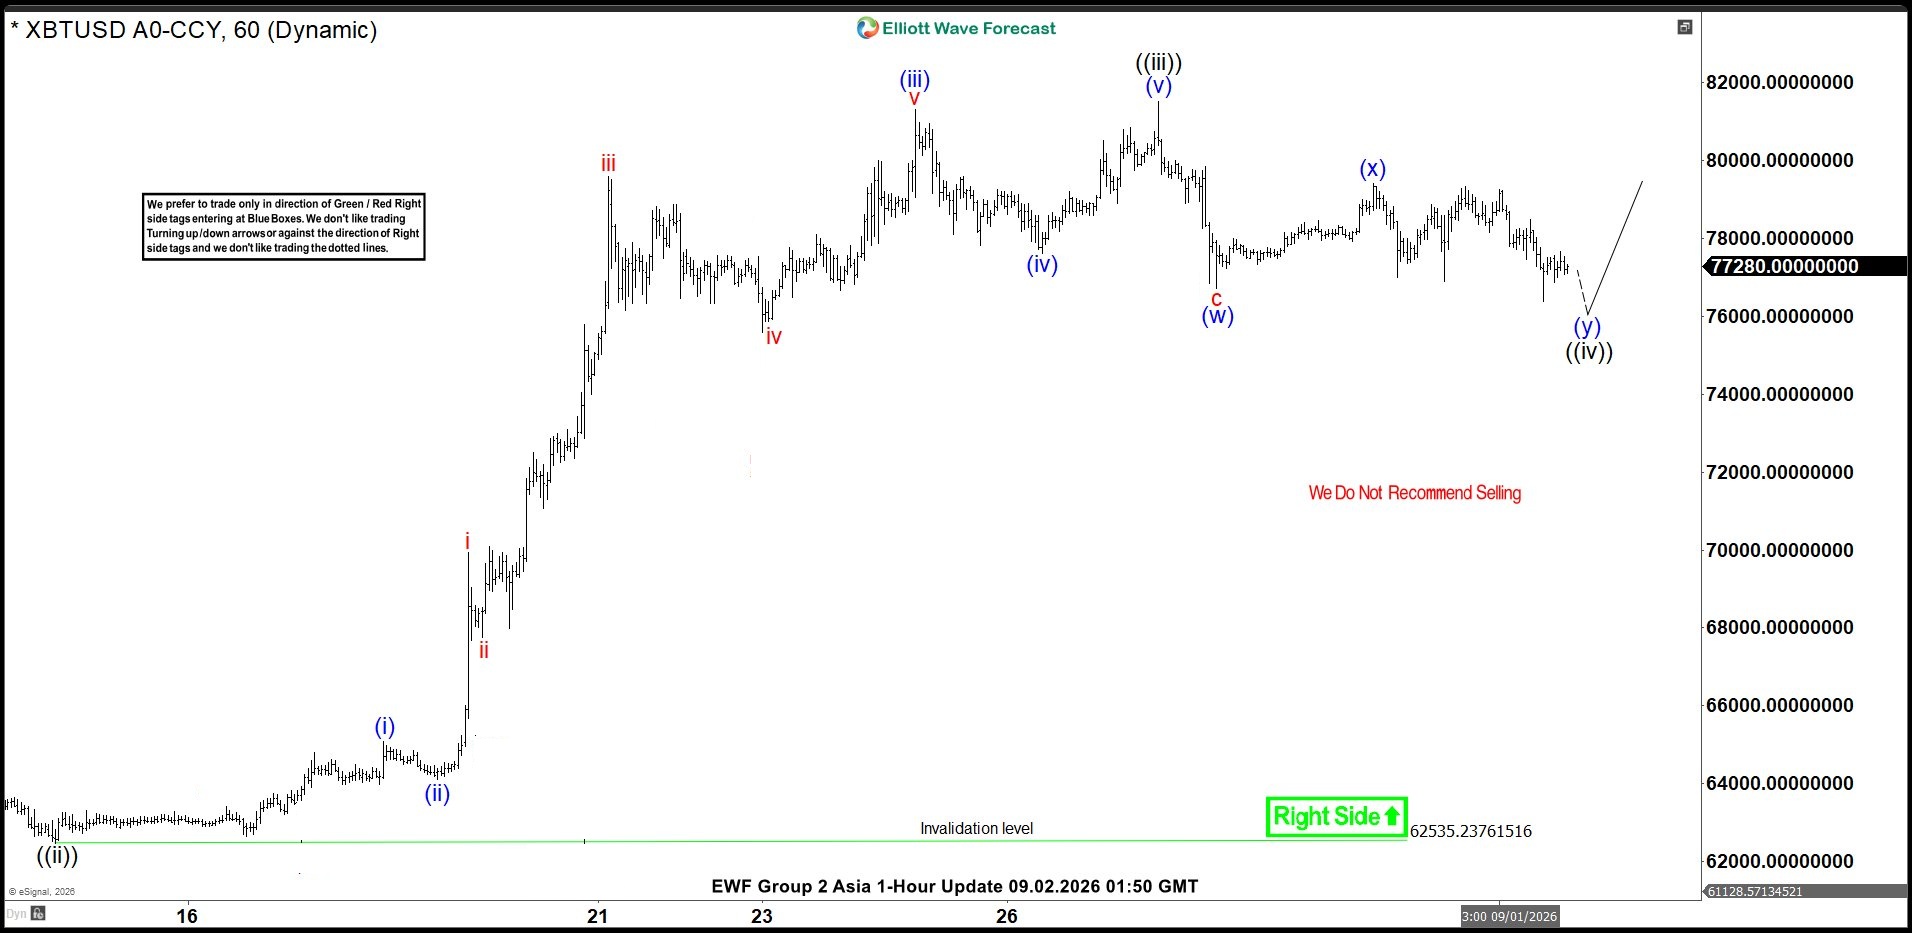
BTCUSD Elliott Wave 1 Hour Chart 09.02.2026
BTCUSD is currently going through a three-wave pullback. The correction is developing as an Elliott Wave Double Three pattern, labeled (w)-(x)-(y). The decline found temporary support near the 0.764 Fibonacci extension of wave (w) relative to (x), around 76,602. However, the pullback still looks incomplete at this stage. As long as the pivot at the (x) connector remains intact, BTCUSD could see another push lower toward the 74,881–72,033 area. A break below the recent 76,463 low would provide stronger confirmation for this scenario.
Alternatively, if Bitcoin continues to hold above the 76,463 low and manages to break above the (x) connector, the correction may already be complete. In that case, BTCUSD could be starting wave ((v)), opening the door for a move toward the 82,662+ area.



Comments
Log in or sign up to join the conversation.