

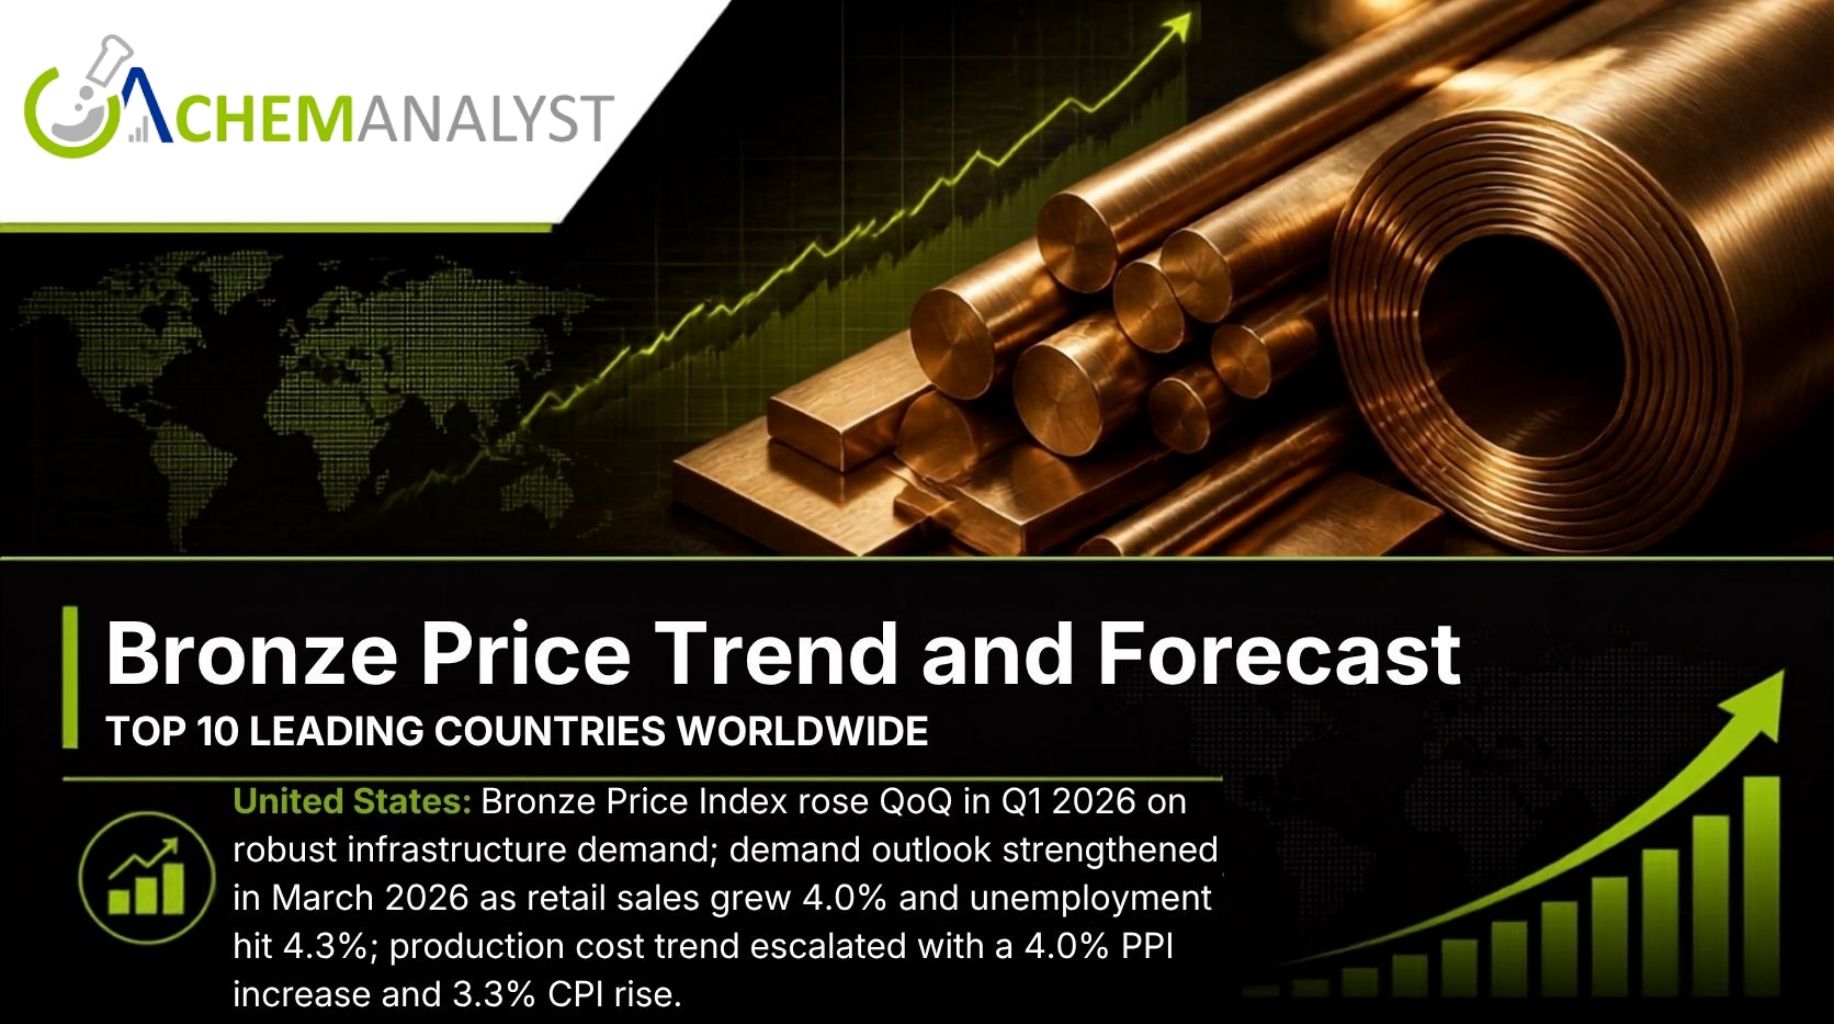
The Bronze Price witnessed varied movements across major global markets during the first quarter (Q1) of 2026 as shifting industrial demand, macroeconomic indicators, and raw material availability influenced regional pricing dynamics. Bronze, an alloy primarily composed of copper and tin, remains an essential material for construction, marine engineering, electrical equipment, automotive components, industrial machinery, bearings, sculptures, and architectural applications.
According to ChemAnalyst Bronze Price: - https://www.chemanalyst.com/Pricing-data/bronze-2333
While the United States recorded an increase in the Bronze Price Index due to strong infrastructure investments and resilient domestic demand, China experienced declining bronze prices amid weakening copper consumption and softer industrial confidence. Meanwhile, Germany posted price gains as tightening feedstock availability and rising production costs increased overall market prices.
For procurement teams, manufacturers, distributors, and investors, understanding the latest Bronze Price movements provides valuable insight into future purchasing strategies and supply chain planning.
Global Bronze Price Overview – Q1 2026
The global Bronze market remained regionally diversified during Q1 2026.
Market Highlights
United States Bronze Price Index increased quarter-over-quarter.
China Bronze Price Index declined due to weaker downstream demand.
Germany Bronze Price Index rose amid tighter feedstock availability.
Infrastructure investments remained the primary demand driver in North America.
Weak consumer confidence slowed industrial activity in China.
Rising inflation increased production costs across Europe.
Overall, Bronze pricing reflected regional economic conditions rather than a unified global trend.
What Drives Bronze Price?
Several interconnected factors influence the Bronze Price worldwide.
Copper Prices
Since copper represents the largest component of bronze alloys, fluctuations in copper prices directly affect Bronze Price trends.
Factors affecting copper include:
Mine production
Global inventories
Smelter activity
Import-export policies
Energy costs
Tin Availability
Tin contributes corrosion resistance and strength.
Any disruption in global tin mining or exports immediately impacts bronze production costs.
Infrastructure Spending
Bronze is heavily consumed in:
Bridges
Public transport
Water systems
Electrical installations
Industrial machinery
Government infrastructure programs often generate significant Bronze demand.
Manufacturing Activity
Industrial production strongly influences Bronze consumption across:
Automotive
Heavy machinery
Marine equipment
Aerospace
Defense
Industrial engineering
Inflation and Production Costs
Higher inflation increases:
Labor expenses
Transportation costs
Energy prices
Manufacturing overhead
These expenses eventually translate into higher Bronze Prices.
North America Bronze Price Analysis
United States Bronze Price Trends
The United States Bronze Price Index increased quarter-over-quarter during Q1 2026, supported primarily by strong infrastructure activity and healthy industrial demand.
Large-scale public infrastructure investments continued to stimulate purchasing across construction, utilities, transportation, and engineering sectors.
Manufacturers maintained stable procurement volumes as infrastructure projects consumed increasing quantities of bronze castings, fittings, bearings, valves, and industrial components.
The steady flow of government-backed investments helped offset uncertainties affecting global metals markets.
Strong Demand Outlook Supported Bronze Prices
Economic indicators reinforced positive market sentiment.
During March 2026:
Retail sales expanded by 4.0%
Unemployment remained relatively low at 4.3%
These indicators reflected resilient consumer spending and continued business investment.
Higher employment levels encouraged manufacturing expansion while improving retail activity signaled broader economic stability.
Industrial buyers therefore maintained purchasing schedules despite elevated production costs.
Key Drivers Behind Rising U.S. Bronze Price
Several factors supported Bronze Price growth:
Infrastructure Development
Construction of transportation networks, utilities, and public infrastructure increased bronze consumption.
Industrial Expansion
Manufacturing facilities continued operating at healthy utilization rates.
Stable Domestic Demand
Engineering, marine, and industrial equipment manufacturers maintained consistent purchasing.
Positive Business Sentiment
Strong macroeconomic indicators improved procurement confidence throughout the quarter.
Read the LinkedIn Article : - https://www.linkedin.com/pulse/bronze-price-trends-2026-global-market-analysis-pricing-kishan-singh-9gosc/
APAC Bronze Price Analysis
China Bronze Price Trends
Unlike North America, China's Bronze Price Index declined quarter-over-quarter during Q1 2026.
The primary reason behind the decline was weaker downstream copper demand.
Since copper forms the majority of bronze alloys, slowing copper consumption significantly reduced bronze purchasing activity.
Lower industrial demand resulted in softer pricing throughout much of the quarter.
Weak Consumer Confidence Reduced Demand
China's industrial sentiment weakened considerably during Q1.
The Consumer Confidence Index fell to 91.6 in February 2026, signaling cautious household spending and reduced business optimism.
Lower confidence translated into:
Slower manufacturing growth
Delayed industrial investments
Reduced machinery production
Softer construction activity
Consequently, downstream bronze consumption weakened across multiple industries.
Manufacturing Slowdown
Bronze-consuming industries experienced reduced order volumes.
These included:
Industrial machinery
Construction equipment
Marine manufacturing
Automotive suppliers
Electrical equipment
Manufacturers became increasingly cautious with inventory accumulation.
Rather than aggressive purchasing, buyers adopted a just-in-time procurement strategy, placing downward pressure on Bronze Prices.
Factors Limiting China's Bronze Price
Major bearish influences included:
Weak copper demand
Lower consumer confidence
Slower industrial expansion
Reduced manufacturing activity
Conservative inventory management
Europe Bronze Price Analysis
Germany Bronze Price Trends
Germany witnessed a quarter-over-quarter increase in the Bronze Price Index during Q1 2026.
Unlike the United States, where demand drove prices higher, Germany experienced rising Bronze Prices primarily because of tightening feedstock supply.
Raw material availability became increasingly constrained, creating upward pressure on alloy production costs.
Feedstock Constraints
European manufacturers encountered tighter supplies of essential inputs.
These included:
Copper
Tin
Industrial alloys
Metal concentrates
Reduced feedstock availability increased procurement competition among bronze producers.
Manufacturers passed higher raw material costs through the supply chain, resulting in higher finished Bronze Prices.
Rising Production Costs
Germany's Production Cost Trend also increased throughout the quarter.
March 2026 Consumer Price Index (CPI) reached 2.7%, increasing expenses associated with:
Energy
Transportation
Labor
Manufacturing operations
Industrial maintenance
As production became more expensive, bronze producers adjusted pricing accordingly.
European Market Drivers
The major contributors included:
Tight raw material supply
Higher manufacturing expenses
Inflationary pressures
Stable industrial demand
Rising operational costs
Global Bronze Supply Chain Outlook
Bronze supply chains remain closely linked to global copper markets.
Key challenges affecting suppliers include:
Copper concentrate availability
Tin supply disruptions
Shipping costs
Energy price volatility
Geopolitical trade uncertainties
Companies increasingly focus on supplier diversification and inventory optimization to reduce procurement risk.
Bronze Demand Across Key Industries
Bronze continues serving numerous industrial sectors.
Construction
Bronze is widely used for:
Architectural fittings
Door hardware
Structural components
Decorative installations
Infrastructure spending remains one of the largest demand drivers.
Marine Industry
Excellent corrosion resistance makes bronze suitable for:
Ship propellers
Pumps
Bearings
Valves
Offshore equipment
Automotive
Automotive manufacturers use bronze in:
Bushings
Bearings
Gears
Electrical connectors
Electrification trends continue supporting specialized bronze applications.
Electrical Equipment
Bronze offers excellent electrical conductivity and wear resistance.
Applications include:
Connectors
Switchgear
Electrical contacts
Industrial controls
Heavy Machinery
Industrial machinery manufacturers utilize bronze for:
Bearings
Bushings
Sliding components
Hydraulic systems
Procurement Intelligence for Bronze Buyers
Purchasing teams should closely monitor several market indicators before placing long-term contracts.
Important indicators include:
Copper Price trends
Tin supply availability
Infrastructure investment
Manufacturing PMI
Inflation
Consumer confidence
Energy prices
Freight rates
Strategic sourcing decisions based on these indicators can improve purchasing efficiency while minimizing exposure to price volatility.
Bronze Price Forecast
Looking ahead, Bronze Prices are expected to remain sensitive to regional economic conditions.
North America
Infrastructure investment is likely to continue supporting Bronze demand.
If manufacturing activity remains healthy, prices could maintain upward momentum.
China
Future pricing will depend largely on improvements in industrial production and copper demand.
A recovery in consumer confidence would strengthen downstream purchasing.
Europe
Feedstock availability and inflation will remain major pricing determinants.
Should supply constraints ease, Bronze Price growth may moderate later in the year.
Market Risks to Watch
Several uncertainties could influence Bronze Prices during upcoming quarters:
Copper supply disruptions
Tin production shortages
Global inflation
Energy market volatility
Freight rate fluctuations
Trade restrictions
Manufacturing slowdowns
Construction demand changes
Procurement professionals should continuously monitor these variables when planning sourcing strategies.
Conclusion
The Bronze Price landscape in Q1 2026 reflected the diverse economic realities of major global regions. The United States benefited from strong infrastructure investment and resilient macroeconomic indicators, supporting higher Bronze Prices. In contrast, China faced weaker copper demand and declining consumer confidence, which weighed on pricing. Germany experienced upward price pressure as constrained feedstock supplies and inflation-driven production costs increased manufacturing expenses.
For procurement professionals, manufacturers, and investors, closely tracking regional economic indicators, copper and tin market dynamics, infrastructure spending, and inflation trends will remain essential for navigating future Bronze Price movements. As industrial activity and supply chain conditions evolve, data-driven sourcing strategies and proactive market monitoring will be key to managing costs and ensuring supply resilience in the global bronze market.
Frequently Asked Questions (FAQs)
What affected the Bronze Price in Q1 2026?
Bronze Prices were influenced by infrastructure demand in the United States, weakening copper demand in China, and tightening feedstock supply alongside rising production costs in Germany.
Why did Bronze Prices rise in the United States?
Strong infrastructure spending, a favorable demand outlook, 4.0% retail sales growth, and a 4.3% unemployment rate supported industrial activity and increased Bronze demand.
Why did China's Bronze Price decline?
China's Bronze Price fell due to stalled copper demand, weaker industrial activity, and a Consumer Confidence Index of 91.6 in February 2026, which reduced downstream purchasing.
Why did Germany experience higher Bronze Prices?
Germany saw Bronze Price increases because tighter feedstock availability and a 2.7% CPI in March 2026 raised production and operational costs for manufacturers.
Which industries consume the most bronze?
Major consumers include construction, marine engineering, automotive manufacturing, electrical equipment, industrial machinery, defense, and infrastructure projects.
Contact -
Address:
420 Lexington Avenue, Suite 300
New York, NY 10170
United States
Phone: +1 332 258 6602
Website: www.chemanalyst.com
LinkedIn: https://www.linkedin.com/company/chemanalyst/
X (Twitter): https://x.com/chemanalysts
Facebook: https://www.facebook.com/ChemAnalysts/
Comments
Log in or sign up to join the conversation.