


Using the Lipper Leaders scoring system to analyse the best-performing funds in the IA Sterling Strategic Bond sector.
It has been a challenging period in global fixed income markets. Yield curves have normalised—steepening left to right, meaning that the yield on short-dated bonds is again lower than their longer-dated equivalents. Central bank policy rates have remained divergent, if generally heading cautiously lower. The dollar has weakened. All while a legion of geopolitical risks have threatened to upturn many markets’ worth of apple carts.
All of which have diverse and interlinked effects on bond markets. You pays your money, you makes your choice. Or, in the case of the IA Sterling Strategic Bond sector, you pays your money to let someone else make the choice for you.
#StrategicBond is both the largest fixed income sector (£135.34bn), and the most popular, attracting more than £29bn over five years—almost double that of gilts, which has pension fund money adding to the wind in its sales. Sterling Corporate and High Yield Bond sectors, meanwhile, have seen redemptions over the period.
It’s easy to understand the attraction: even for professional investors, the world of fixed income is a lot to get your head round: spread, duration, currency, credit risk… the list goes on. We all think we understand equities, but bonds? Well… So best to let a proper expert figure it out. Has that been a good bet, on average?
Comparing the sterling bond sectors for longer periods: over five years, the Sterling Corporate Bond averaged a return of -1.9%; Sterling High Yield, 20.46%; Sterling Strategic Bond, 7.69%, and UK Gilts, -22.26%. Duration was clearly a major factor here (see below), and investors were served quite well by Strat Bond.
Over the very long term, however, it is less impressive. Over 20 years, Sterling Corporate Bond returned 92.68%; Sterling High Yield, 212.7%; UK Gilts, 51.5%, and Sterling Strategic Bond, 74.69%. You would expect, over the longest period, High Yield to outperform, given its inherently higher risk, but it’s interesting that Strat Bond returns sit between Corporate and dusty old Gilts.
One change that’s notable from last year is the relative absence of short-duration funds among the top performers over three years, the exception being the Royal London Short Duration Credit fund. 2022’s inflation-induced interest rate spike caused significant fixed-income losses: in general, the longer a fund’s duration, the greater the loss, duration being a bond’s, or fund’s, sensitivity to changes in interest rates. Those funds with lower duration were therefore better shielded from the impact. So, for example, UK Gilt funds lost an average of 22.44% over the year, while shorter duration Sterling High Yield lost 16.21% while Sterling Corporate Bond fell 12.3%. Strat Bond’s losses were in line with the latter, at -11.79%. Their non-sterling Global bond equivalents, however, suffered losses in the low to middle single-digits, indicating currency exposure played a major role.
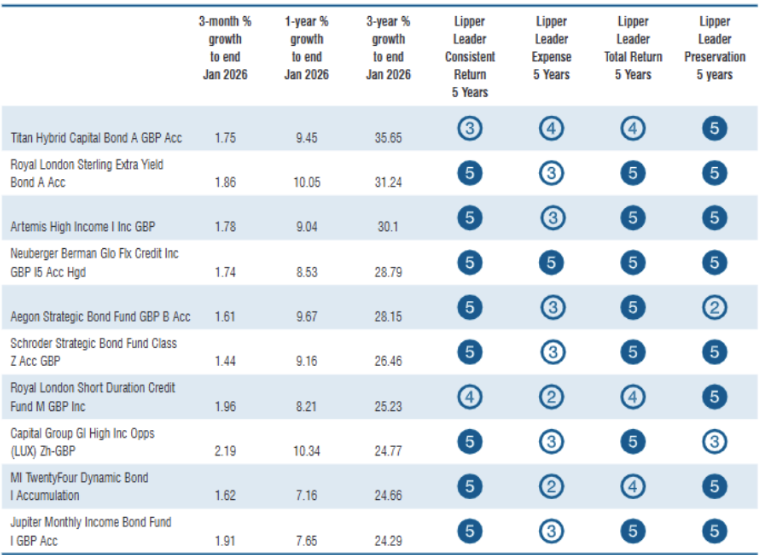
Three funds remain in the table from this time last year: the Royal London Sterling Extra Yield Bond fund was also there in 2024’s table. The fund can also hold up to 10% equities, a freedom that it has made use of, and as of January 2026 was holding 8.4% in equities.
The Artemis High Income fund also retains its place from last year. Lipper classifies the fund—along with a couple of others in the sector—as Mixed Asset GBP Conservative – Global; meaning, it can hold a moderate proportion of equities. Its documentation allows up to 20%, though historically it has operated at about 15%. This is clearly serving it well, and you may be happy to hold it, but investors should be aware that it’s not a “pure” bond fund.
Top over three-year returns is the Titan Hybrid Capital Bond fund. This is a slightly unusual fund for the sector, as it specialises in subordinated or hybrid bonds—debt instruments ranking below ordinary senior debt but above common equity.
It’s clear, then, that picking this, the broadest bond sector, and going by performance doesn’t present any straightforward answers, as there are many fundamentally different approaches even within this one corner of the fund market.
Table 1: Top-Performing Sterling Strategic Bond Over Three Years (with a minimum five-year history)
All data as of January 31, 2026; Calculations in GBP
Source: LSEG Lipper



Comments
Log in or sign up to join the conversation.