

Hey everyone! If you caught my livestream earlier today, you know we just witnessed an absolute wild session in Broadcom (AVGO) following their high-stakes fiscal second-quarter 2026 earnings drop.
On one hand, the fundamental numbers Broadcom is printing right now are insane, thanks to an unquenchable global demand for custom AI ASICs and networking gear. On the other hand, the market is pricing this thing to absolute perfection.
In this write-up, we are breaking down the core financial numbers, unpacking a historic valuation anomaly that just triggered for the first time ever, and looking at the exact TrendSpider automated trendlines that predicted today’s institutional profit-taking.
1. The Raw Numbers: Broadcom Crushes Q2 Estimates
Let’s get the fundamental data out of the way first. Broadcom’s Q2 results prove that the artificial intelligence infrastructure boom isn’t slowing down—it’s accelerating. Total revenue clocked in at a record-shattering $22.19 billion, climbing 48% year-over-year and beating Wall Street’s $22.04 billion forecast.
Q2 2026 Financial Scorecard
Key Financial Metric | Wall Street Consensus | AVGO Q2 Reported | Year-over-Year (YoY) Change |
Total Revenue | $22.04 Billion | $22.19 Billion | +48.0% |
Adjusted EPS | $2.40 | $2.44 | +1.6% Beat |
AI Semiconductor Revenue | $10.20 Billion | $10.80 Billion | +143.0% |
Free Cash Flow (FCF) | — | $10.26 Billion | 46.2% FCF Margin |
The real star of the show? AI Semiconductor Revenue. It hit $10.8 billion for the quarter, exploding 143% compared to last year. CEO Hock Tan noted that hyperscalers are aggressively buying up their custom AI accelerators and high-performance Ethernet switching matrices. Looking ahead to Q3, Broadcom expects total revenue to surge to $29.4 billion.
2. The Big Fundamental Story: Price Crosses Revenue Line for the First Time in History
During the livestream, I pulled up a chart that left a lot of macro analysts scratching their heads. For the first time in Broadcom’s history as a public company, the absolute spot price line of the stock has scaled above its Trailing Twelve Month (TTM) revenue line when indexed on a multi-year fundamental tracking layout.
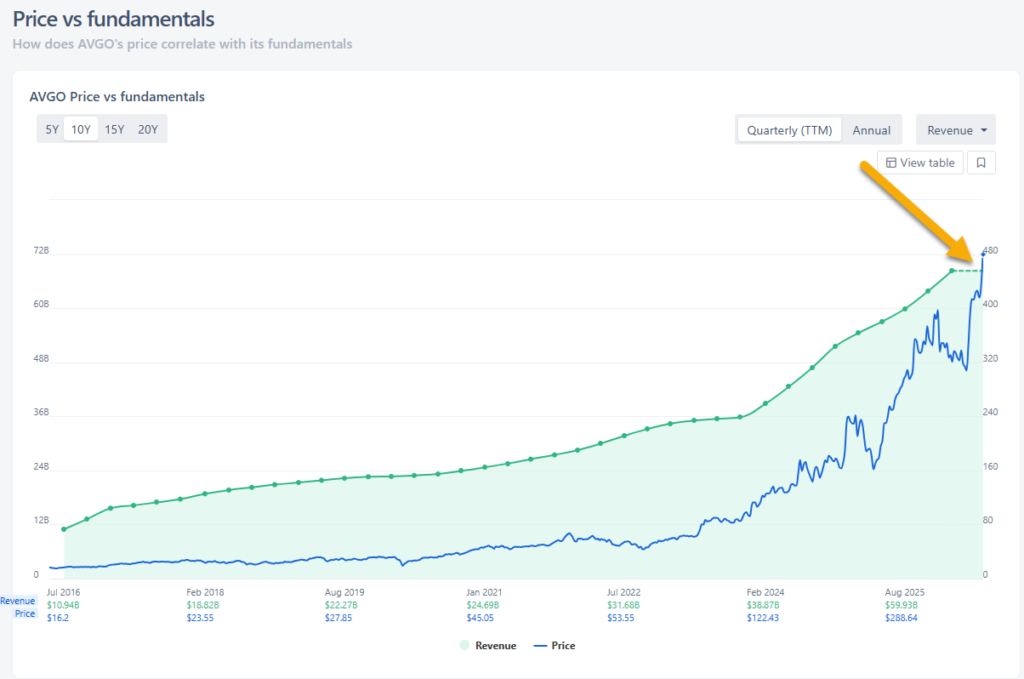
Chart Visual Reference (image_85d3eb.png): Notice the orange arrow pointing directly to the far right of the chart. The blue price line has spiked vertically, breaking out completely above the green shaded TTM revenue boundary ($72B level) for the first time in corporate history.
Historically, AVGO trades within a beautifully predictable correlation band—price moves hand-in-hand with multi-year revenue compounding cycles. What this chart tells us is that we are in a period of intense structural multiple expansion. Investors are aggressively front-running multiple years of future hyperscale network spending well before those dollars actually hit Broadcom’s bank account.
3. The Technical Matrix: How TrendSpider’s Automated Trendlines Nailed the Rejection
If you were watching the tickers today, you saw AVGO stock go on a wild ride. The price spiked aggressively to an intra-session high of nearly $495.00 before hitting a massive wall of supply, sending it down to a closing print of $479.23.
That exact top wasn’t random luck. It was perfectly mapped out ahead of time by TrendSpider’s Automated Trendline Detection.
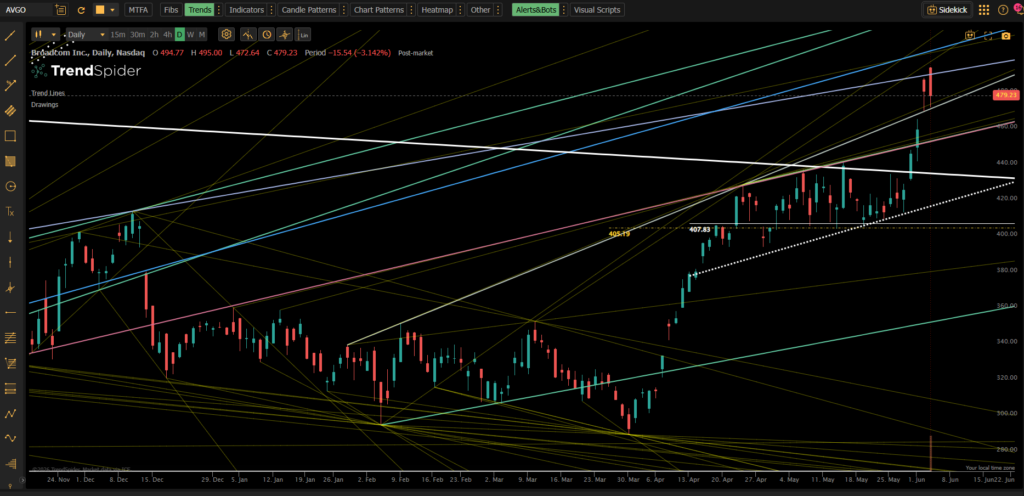
The daily candlestick chart shows how TrendSpider’s machine-generated trendlines perfectly caught the exact upper wick of today’s price action, confirming a severe rejection at the multi-month ascending channel ceiling.
As we looked at on stream, TrendSpider’s algorithms uncovered a few critical things:
The Channel Ceiling: The precise point where the stock turned around today natively intersected with an automated multi-point resistance line connecting the macro highs of late 2025 and early 2026.
Algorithmic Confluence: Three distinct machine-generated mathematical vectors collided right around the $495 level, making it a highly toxic zone for retail buyers to chase.
Downside Support Targets: If the broader markets start taking profit, TrendSpider has already flagged clear horizontal support revalidation levels sitting lower at $407.83 and $405.19.
The Blog Takeaway: How to Play AVGO Next
Broadcom is an absolute powerhouse fundamental business. It basically owns a near-monopoly on high-end custom Silicon ASICs. If you’re a long-term tech investor, it’s hard not to love the company’s trajectory.
Tactically, though? Chasing the stock right here is incredibly risky. When price scales above fundamental tracking benchmarks for the first time in history and automated technicals show institutional selling at the channel top, patience is your best friend.
Smart traders should look for a healthy consolidation or a mean-reversion drop back toward those TrendSpider automated support bands before aggressively adding to core positions.

Comments
Log in or sign up to join the conversation.