


The crypto market experienced another broad advance this past week, with gains spread across most large assets even as the pace varied sharply. SUI and BCH ran far ahead of the field, while BTC and ETH rose more slowly and remained closer to the middle of their recent ranges.
That mix matters because a wide market can still depend heavily on a few fast leaders.
Participation broadened into the Saturday close, but the return gap between the leaders and the largest assets remained substantial. The next test is whether the wider group can keep moving while the leaders digest, or whether that performance gap begins to pull the broader count lower.
Crypto Market Breadth Strengthens as Large Caps Lag
Total crypto market capitalization stood near $2.896 trillion after Saturday's candle closed, up 0.55% over 24 hours. A reconstructed rolling seven-day screening showed the measure rose 5.46%.
Eighty-seven of the top 100 assets were positive over seven days, against 13 negative. A cleaned top-50 screen showed 37 positive names and 3 negative, with a +12.58% median and a +5.89% cap-weighted return. The 6.69 percentage-point gap shows established assets outran the largest names.
Meanwhile, Bitcoin dominance was 58.7% after BTC gained 4.90% on CoinMarketCap's rolling week, while Ether (ETH) gained 4.19%, leaving both below the cleaned median. Strength extended across several groups, led by a +18.96% median for the payments and value-transfer basket. Large L1s had a +11.36% median, while relative laggards included TRX at -2.02%, BNB at +2.83%, BTC, and ETH.
Participation measures were supportive but incomplete. DeFiLlama's revisable stablecoin series rose from $309.994 billion to $311.598 billion over seven days, a gain of 0.52%. Data from Farside shows inflows of roughly 2.39 billion for the five trading sessions of U.S. spot BTC ETF flows, from September 21 through September 25.
SUI Leads Large-Layer-1 Gains
SUI supplied the clearest large-L1 leadership for the week. Its CoinMarketCap rolling seven-day return was +42.17%, more than three times the +12.58% cleaned median. At the time of writing, TradingView showed SUI/USD at $1.1658 with a weekly-performance reading of +37.04%. Coinbase's September 18 through the closed September 26 candle returned +57.02% across a range of $0.7367 to $1.2171.
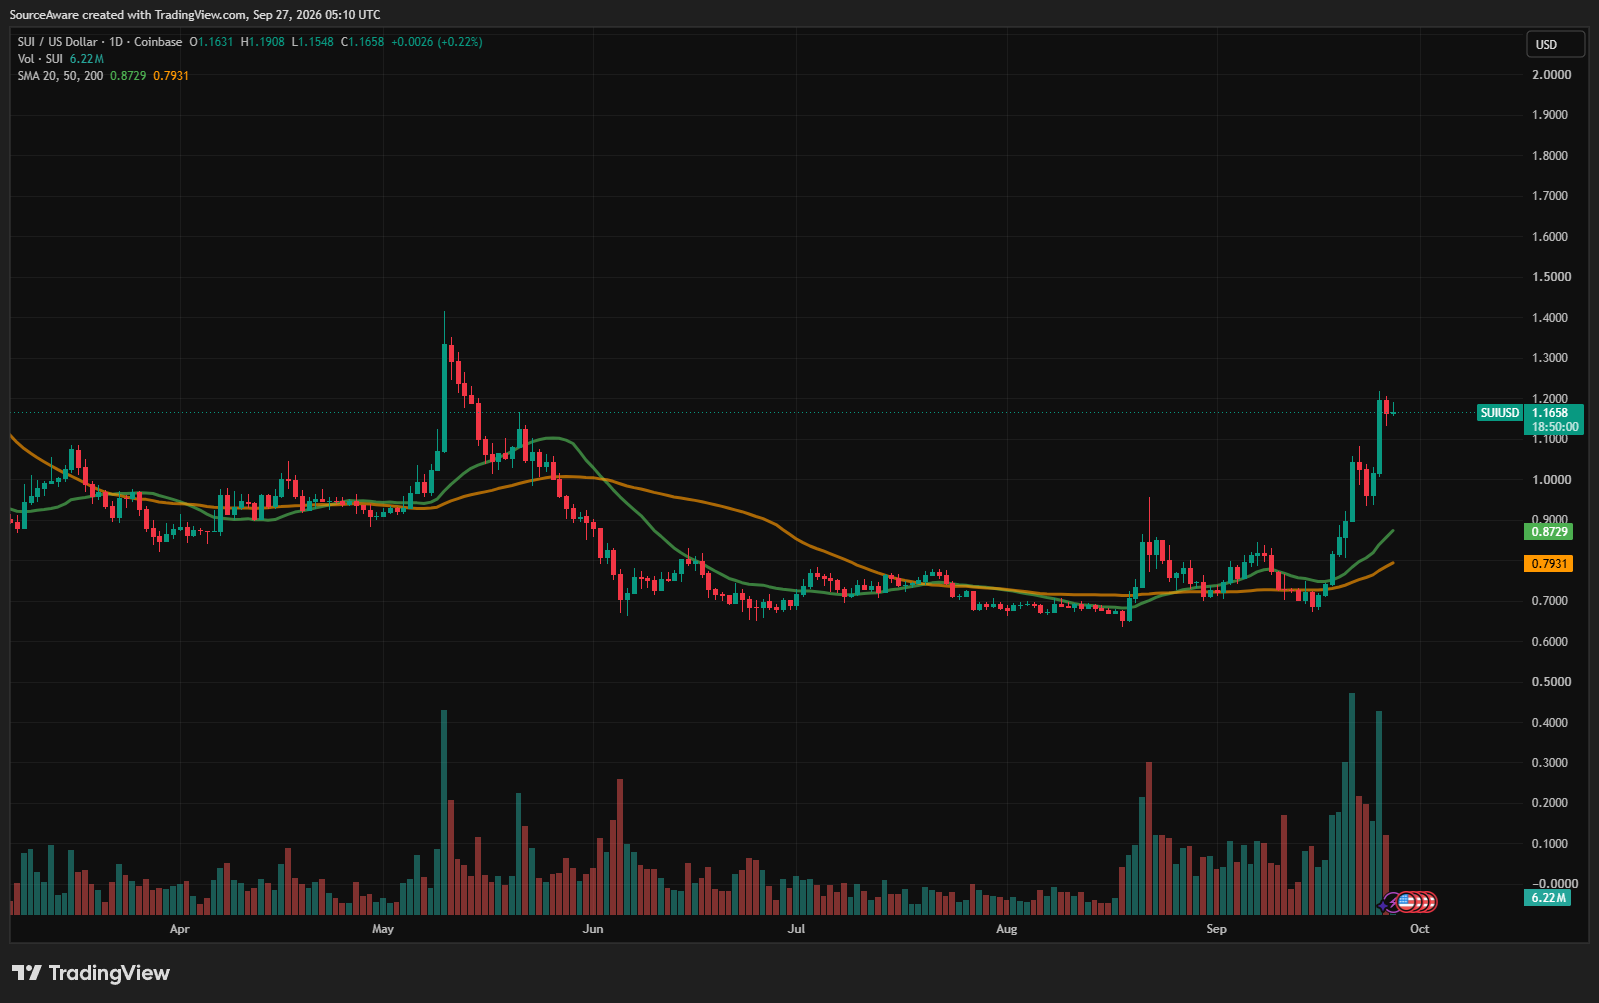
That move gave SUI the widest separation from its daily trend references. Its 20-day simple moving average was $0.8729 and its 50-day average was $0.7931. Price sat about $0.301 above the shorter average after trading close to the top of the Coinbase range. That distance confirms leadership and greater exposure to a sharp change in pace if participation narrows. The data supports a relative-strength reading; it does not identify a catalyst or establish uniform strength across large L1s.
Bitcoin Cash Joins the Week’s Strongest Performers
By contrast, BCH offered a second leadership case. CoinMarketCap placed its rolling seven-day gain at +36.10%. TradingView showed BCH/USD at $332.10 with a +30.67% weekly-performance reading, and Coinbase recorded +43.83% from September 18 through the closed Saturday candle. That window ranged from $232.96 to $366.13.
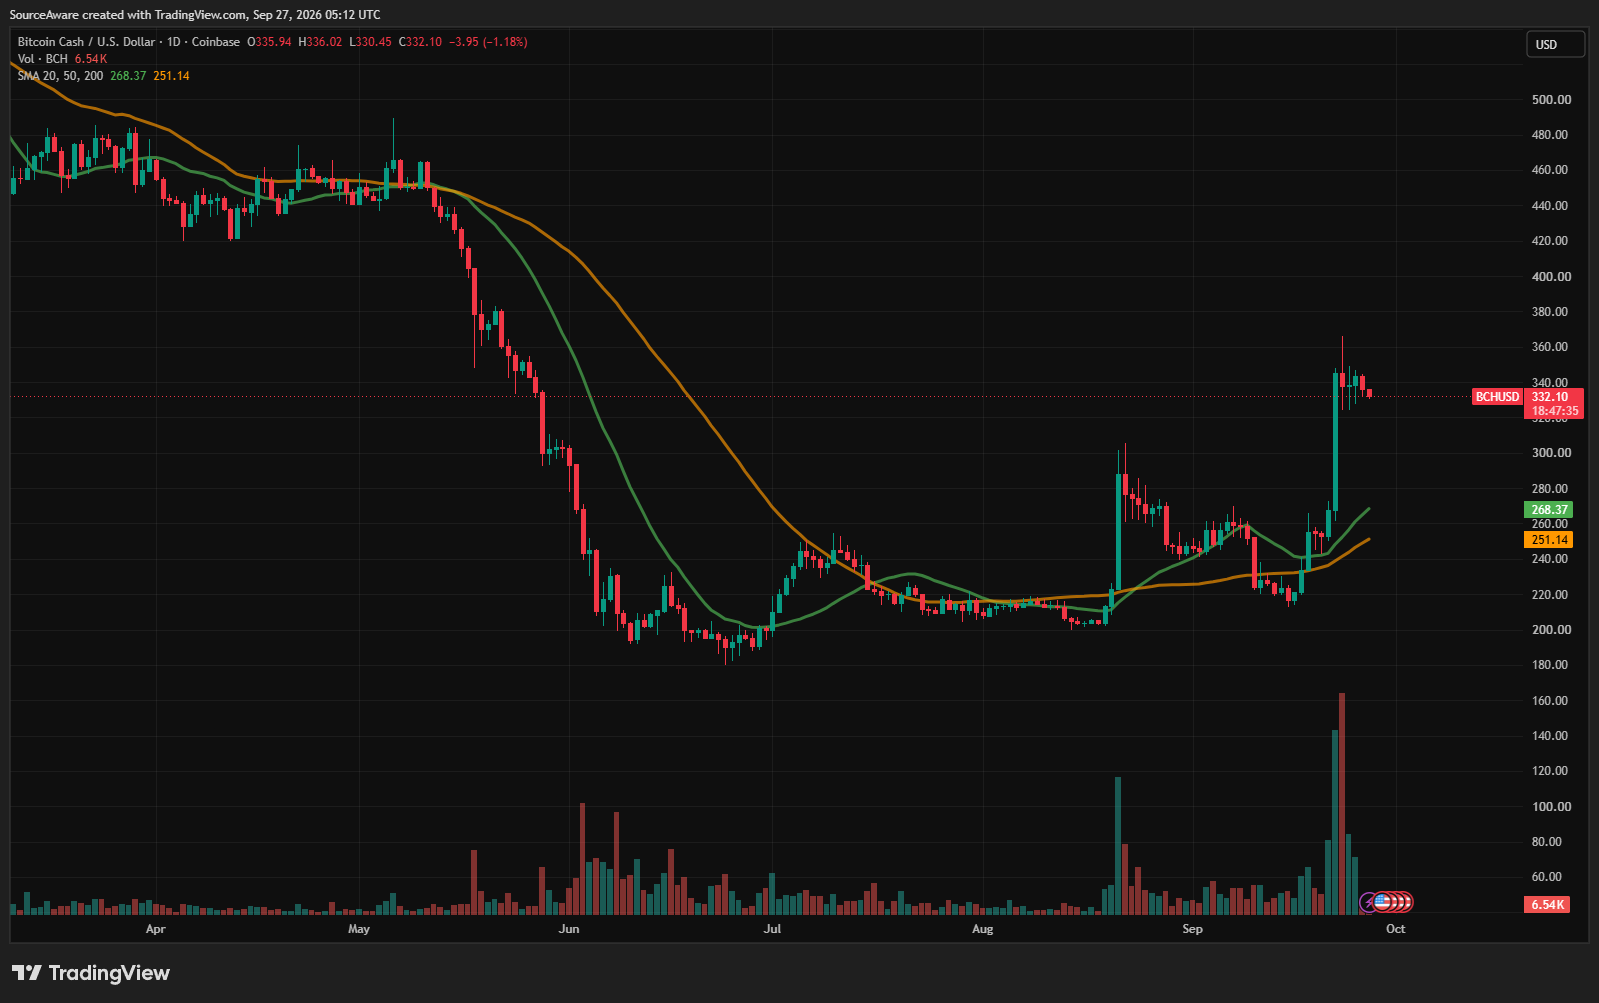
The pair remained above its 20-day average of $268.37 and its 50-day average of $251.14. The early Sunday price was about $33.21 below the window high after a negative daily move, making BCH useful for testing whether a leader can cool without losing the broader structure. BCH and LTC lifted the payments and value-transfer basket above the other fixed groups, but synchronized strength does not prove a common cause or lasting category revival.
Bitcoin Holds a Constructive but Slower Pace
Meanwhile, Bitcoin participated while trailing the typical established asset. TradingView showed BTC/USD at $84,363, a weekly-performance gain of +3.89%. Coinbase's September 18 through the closed September 26 candle returned +10.57%, with trading between $76,205.46 and $87,397.00. CoinMarketCap's rolling seven-day return was +4.90%.
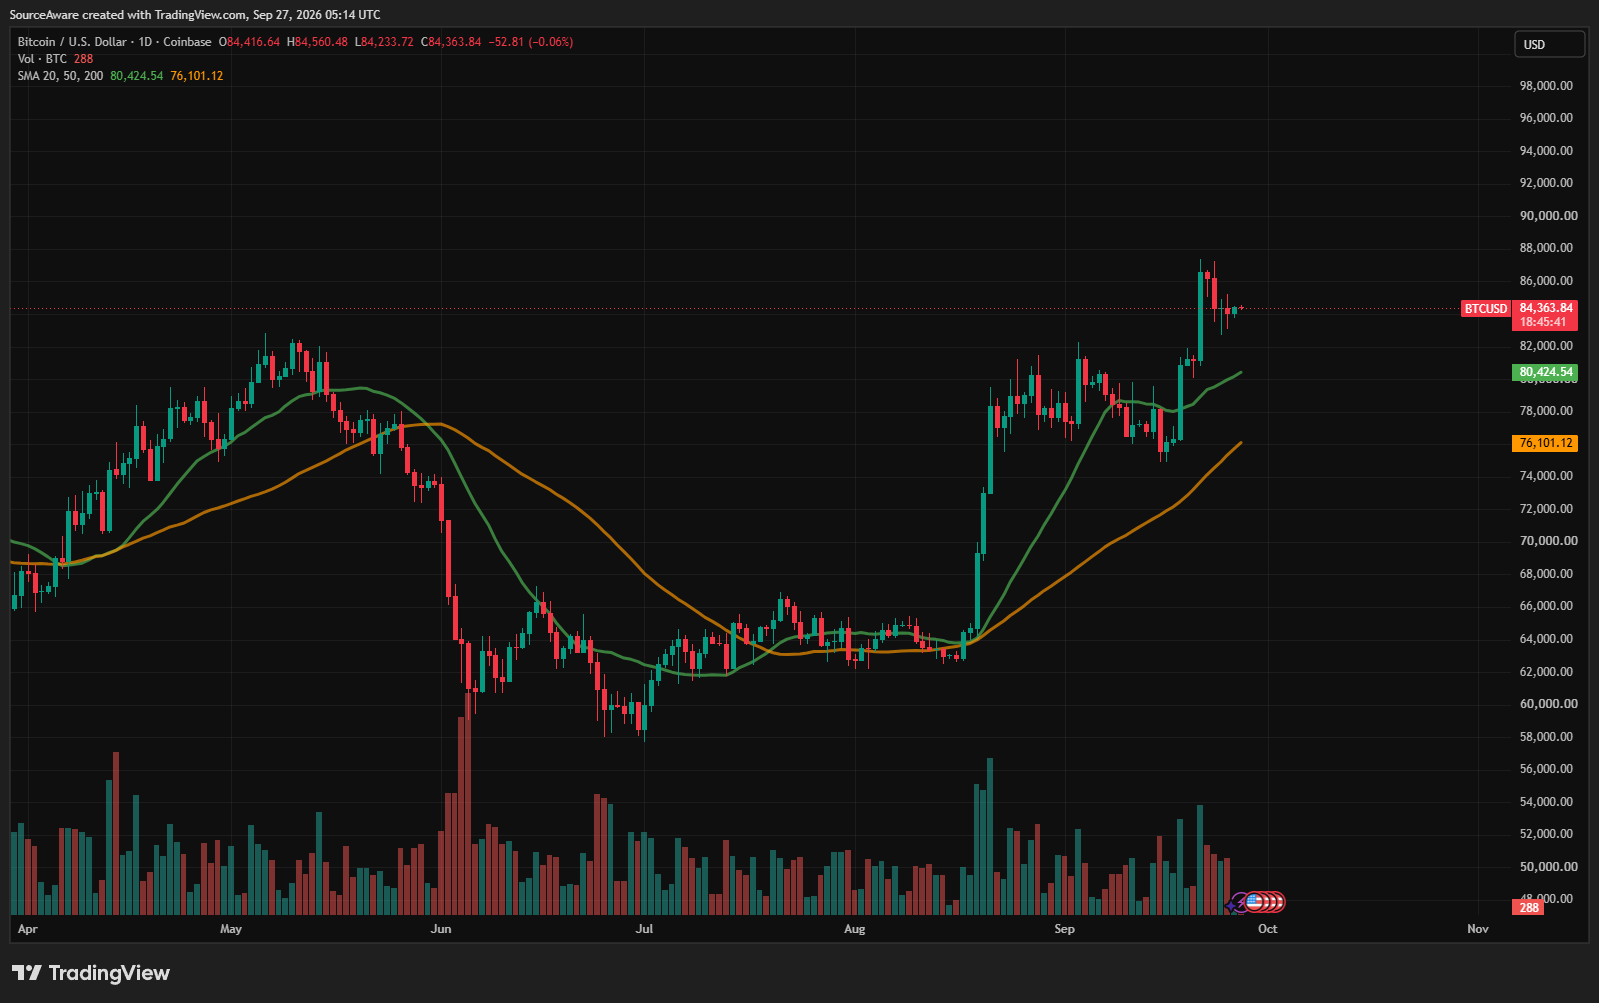
BTC remained above both daily trend references: the 20-day average was $80,424 and the 50-day average was $76,101. That placement kept the technical picture constructive even though the rolling return trailed the cleaned median by 7.68 percentage points.
With dominance at 58.7%, Bitcoin continued to carry most of the market's structural weight without setting its performance pace. A renewed rise in BTC alongside higher dominance would change that relationship; a decline in dominance with stable breadth would keep the broader-participation reading intact.
Ethereum Lags Despite Positive Technical Structure
That same positive-lag role appeared in ETH. TradingView showed ETH/USD at $2,694.95 with a weekly-performance return of +2.47%. Coinbase measured +10.23% from September 18 through the closed September 26 candle, with a low of $2,434.60 and a high of $2,807.10. CoinMarketCap's rolling seven-day figure was +4.19%, trailing the cleaned median by 8.39 percentage points.
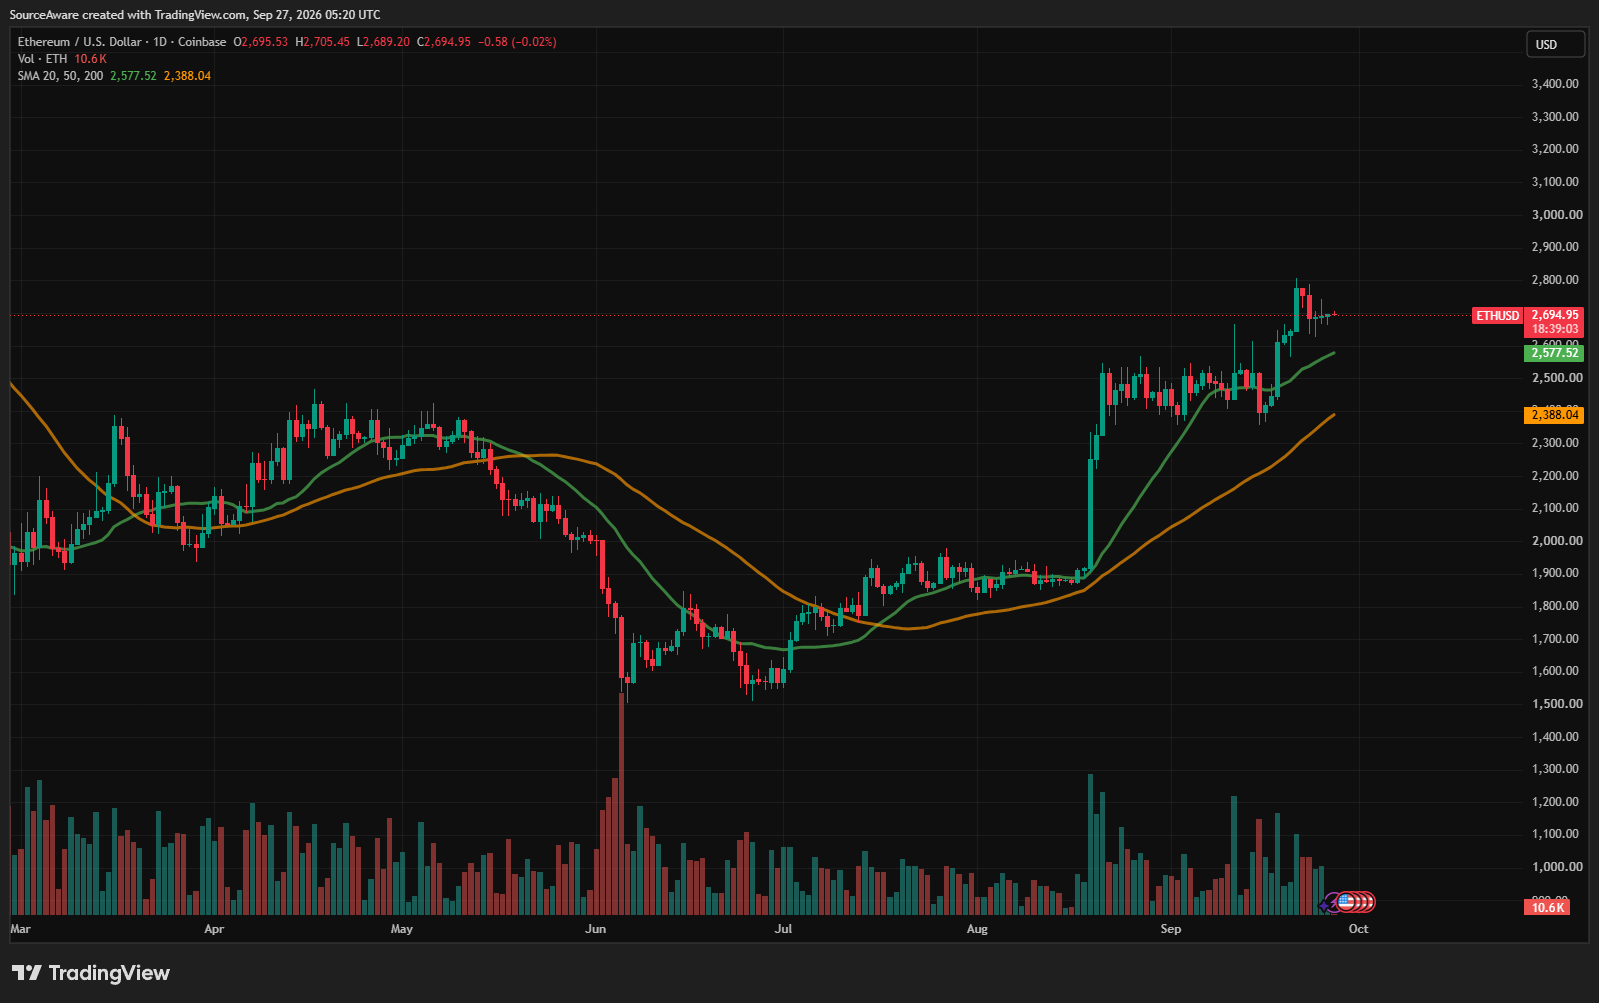
The pair was above its 20-day average of $2,577.52 and its 50-day average of $2,388.04. Its distance above the shorter average was far smaller than the corresponding gaps for SUI and BCH, which fits the broader split between high-beta leaders and slower large assets. ETH therefore adds more than a second bellwether chart: it shows that a pair can remain above both trend references, post a positive week, and still rank as relative weakness inside a strong field.
Strong Breadth Does Not Remove Rally Risks
Broad counts can create a cleaner picture than the return distribution deserves. An 87/13 top-100 split shows wide participation, yet the cleaned median outran the cap-weighted result by 6.69 percentage points. SUI and BCH were far above their 20-day and 50-day averages, while BTC and ETH gained less than half as much as the median on CoinMarketCap's rolling measure. The advance reached many assets, but it rewarded them unevenly.
The top-100 count had slipped from 83 positive names Thursday to 80 on Friday, then widened to 87 after the Saturday close. The cleaned median finished at +12.58%, below Thursday's +14.11% snapshot but well above the late-morning Saturday reading. Breadth therefore strengthened into the close even as the largest assets remained behind the typical established name.
The liquidity evidence needs the same restraint. Stablecoin supply rose over the measured week, and five completed ETF sessions recorded inflows. Friday's ETF row ultimately added $134.5 million, the stablecoin history can revise, and timing alone cannot connect either series to the pair-level moves. A broad rally with positive participation evidence still leaves room for fast leaders to retrace or for the large assets to remain slow.
What Could Sustain the Broader Crypto Advance
The breadth reading could remain durable even if SUI and BCH stop climbing. Other established assets may continue advancing while the current leaders consolidate, allowing the median to stay firm without another surge in the highest-return pairs.
BTC and ETH remained above their 20-day and 50-day averages after the close, so stronger participation from either could narrow the performance gap without requiring the smaller leaders to keep accelerating.
But the opposite test is equally clear. A renewed fall in the positive count, a lower cleaned median, and simultaneous weakness in SUI and BCH would turn the late expansion into a more fragile result. A stable or stronger breadth reading would give the closed Saturday count more staying power. The next sessions will show whether the wider participation survives once the strongest pairs are no longer extending at the same pace.
Overall, the market closed Saturday with broader participation, clear leaders, and two bellwethers moving at a slower pace. The week ahead should reveal whether the positive count can hold as SUI and BCH digest and whether BTC and ETH close part of the gap. Friday's ETF flows were positive, but the relationship between breadth, leadership, and the largest assets remains unsettled.


Comments
Log in or sign up to join the conversation.