


The Pound Sterling (GBP) drops for the fourth straight trading day versus the US Dollar (USD) on Thursday, down 0.21%, as Federal Reserve (Fed) officials remain hawkish and US jobs data shows labor market strength. GBP/USD trades at 1.3213 after hitting a daily bottom of 1.3209, its lowest level since June 29.
Sterling sinks as hawkish Fed signals and strong jobs reinforce Dollar demand
Sentiment is downbeat as global bond yields rise, a headwind for stocks worldwide. The US 10-year Treasury yield is up 5 basis points to 5.162%, boosting the Greenback. The US Dollar Index (DXY), which measures the performance of the buck versus six currencies, is up 0.19% to 101.30.
Investors pricing in further tightening by major central banks, particularly the Federal Reserve, sent government bond yields soaring, as Oil prices jumped over 4% amid a lack of progress in talks between the US and Iran.
In fact, the tone turned harsh. Iran's Major General Safavi said that the Strait of Hormuz would never reopen in the same way, adding that Iran and Oman had reached an agreement on a mechanism to manage the strait.
Aside from this, Federal Reserve officials crossed the wires. New York Fed John Williams said that it is reasonable to see another rate hike this year, echoing comments from Philadelphia Fed Anna Paulson, who said “more rate hikes may be needed” to quell inflation.
Earlier, Cleveland Fed Beth Hammack warned that inflation pressures remain tilted to the upside, reaffirming her hawkish stance.
Meanwhile, US Initial Jobless Claims for the week ending September 19 came at 197K, below the previous week's reading of 198K and forecasts of 201K
In the UK, business activity cooled in September, while inflationary pressures built, exerting pressure on the Bank of England (BoE). The BoE stood pat at its September meeting, but Governor Bailey opened the door to rate increases.
Ahead, the UK economic docket will feature the GfK Consumer Confidence for September. Across the pond, US Durable Goods Orders and Consumer Sentiment will provide an update on the economy.
GBP/USD Price Forecast: Technical Outlook
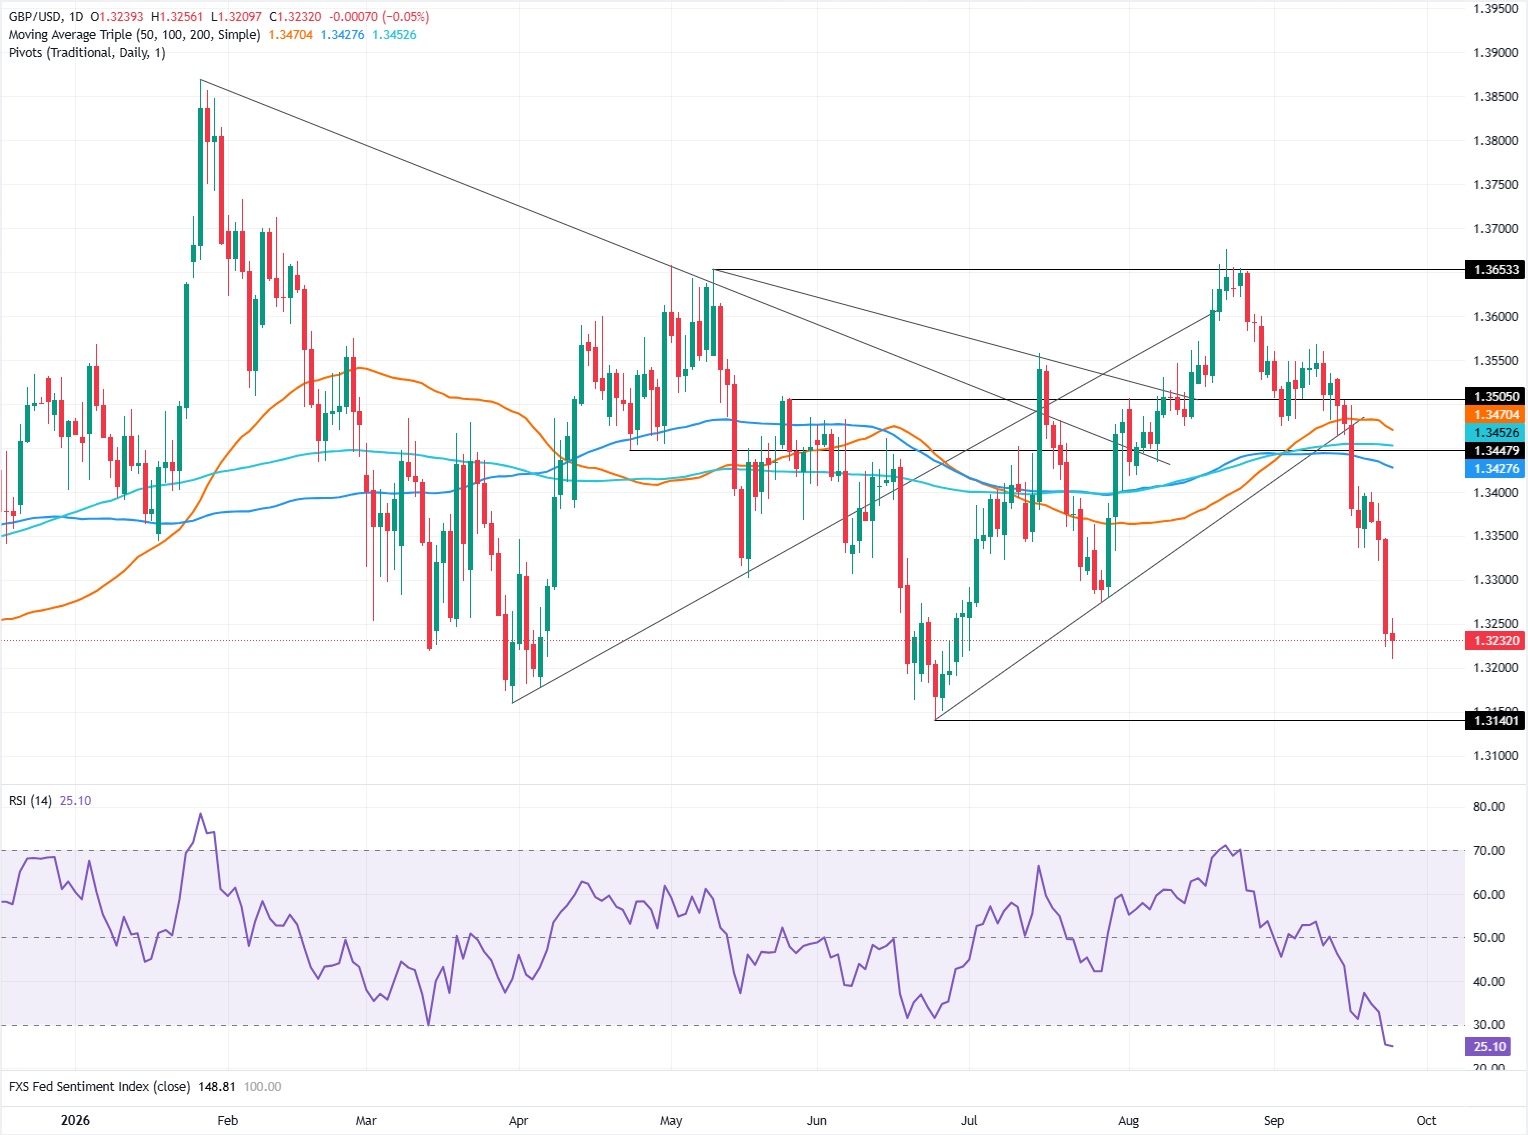
GBP/USD daily chart
In the daily chart, GBP/USD trades at 1.3232, extending a clear bearish bias as spot holds beneath the cluster of major simple moving averages around 1.3470 and below multiple broken trend-line supports that now act as resistance between roughly 1.3331 and 1.3512. The Relative Strength Index (14) at 25.1 sits in oversold territory, hinting that downside momentum is stretched but not yet signaling any meaningful recovery while price action remains capped by these overhead technical barriers.
On the topside, initial resistance emerges at the former downtrend break near 1.3331, followed by the descending resistance trend line around 1.3446 and the grouped 50/100/200-day simple moving averages near 1.3470. Above that zone, the prior rising support lines turned resistance at 1.3512 and 1.3720 define a broader ceiling, and only a sustained move back over these levels would ease the current bearish pressure and open room for a more durable rebound.
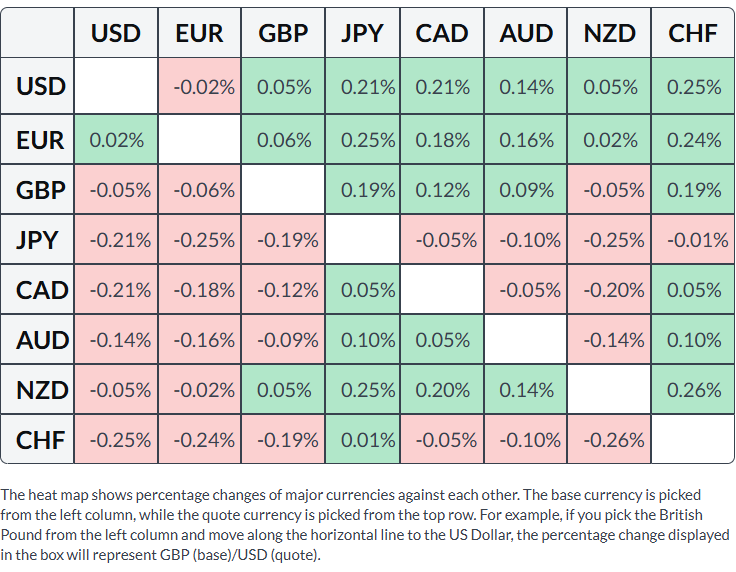
Pound Sterling Price Today
The table below shows the percentage change of British Pound (GBP) against listed major currencies today. British Pound was the strongest against the Japanese Yen.



Comments
Log in or sign up to join the conversation.