

If it's Tuesday, it's time to focus on the trend and momentum of the market. We start each week with a review of the primary market cycles through the lens of our big-picture primary cycle models. Next, I like to review the market's trend and momentum via our indicator boards and running through some charts.
Although I promise not to make music references to the stock market's action every week, the theme to this week's technical review can be summed up with the refrain from The Door's hit, "Break On Through (To The Other Side)" as the S&P 500 appears to be breaking out of the trading range that has been in place since early June.
Next, let's take a look at the state of our trend and momentum indicators.
The State of the Trend Indicators
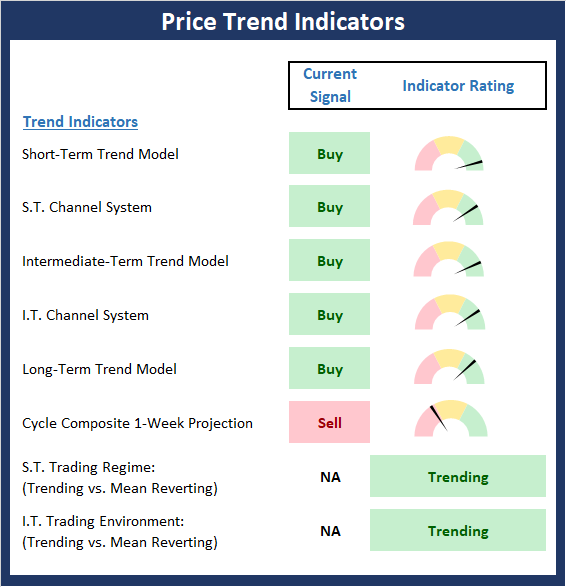
The Trend board indicators are designed to determine the overall technical health of the current stock market trend in terms of the short- and intermediate-term time frames.
The trend board improved nicely over the past week as both the Short-Term Trend and Channel System indicators moved up into the green zone. The only stick in the mud here is the weekly view of the market's cycle composite, which points lower for the week. The good news is the cycle composite suggests stocks could move higher for the next several weeks before succumbing to the traditional pre-election jitters. But for now, the Price board suggests that the trend is our friend.
* Source: Ned Davis Research (NDR) as of the date of publication. Historical returns are hypothetical average annual performances calculated by NDR. Past performances do not guarantee future results or profitability - NOT INDIVIDUAL INVESTMENT ADVICE.
My Take on the State of the Charts...
One of the most positive things a market can do is to break out of a range. Especially if there is some "oomph" behind the move (we'll look at that via the momentum boards in a moment). The bottom line is breakouts to the upside often lead to a new, sustained leg higher. As such, this week's action so far is encouraging.
But... (you knew that was coming, right?) The breakout must hold. Unfortunately, in this day and age of computerized trading, breakouts too often become "fake outs" as mean reversion trades tend to be placed at obvious price points on the chart. So, for the bulls to get excited, we will need to see the S&P 500 remain above the breakout level for several days - with a successful test or two of the breakout being preferred.
S&P 500 - Daily
(Click on image to enlarge)

Turning to the NDX, I wrote last week that the market darlings were due to take a break. And while yesterday's outperformance of the megacap leaders was indeed impressive, I can argue that a trading range may be developing on the NDX. This would be a good way for a consolidation to unfold here as the leaders could "rest" while the broader market plays catch up. However, so far at least, the broad market isn't really catching fire. Something to watch going forward.
NASDAQ 100 - Daily
(Click on image to enlarge)

The State of Market Momentum
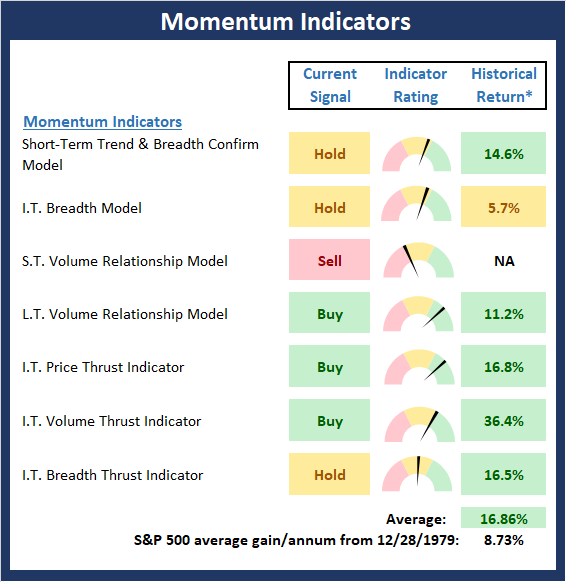
Once we've reviewed the state of the charts, we then analyze the internals to determine if there is any "oomph" behind the current trend via our group of market momentum indicators/models.
Overall, the Momentum Board has improved over the past week as the Short-Term Trend and Breadth Confirm, Volume models upticked as did the Intermediate-Term Price and Volume Thrust models. This is a good thing as momentum appears to be confirming the movement in price. However, I am a bit concerned that the Short-Term Volume Relationship Model produced a fresh sell signal. This simply shouldn't be happening. As such, the board suggests that the bulls may not be in the clear and that a "breakout fake out" remains a possibility.
* Source: Ned Davis Research (NDR) as of the date of publication. Historical returns are hypothetical average annual performances calculated by NDR. Past performances do not guarantee future results or profitability - NOT INDIVIDUAL INVESTMENT ADVICE.
The Bottom Line
As the saying goes, the trend is your friend. To borrow another old Wall Street adage, the thinking is that a trend in motion tends to stay in motion. But in order for these clichés to work for investors here, I'm of the mind that we need to see the market "broaden out" a bit. While a "nifty fifty" type of market environment (a market where leadership is concentrated among a handful of leaders such as the current "FANMAG" situation) can last a long time, healthy market advances include both "the troops" and the "generals." Therefore, I'll be watching the action in the small- and mid-caps for signs of "broadening."



Comments
Log in or sign up to join the conversation.