

EUR/USD
4 hour
(Click on image to enlarge)
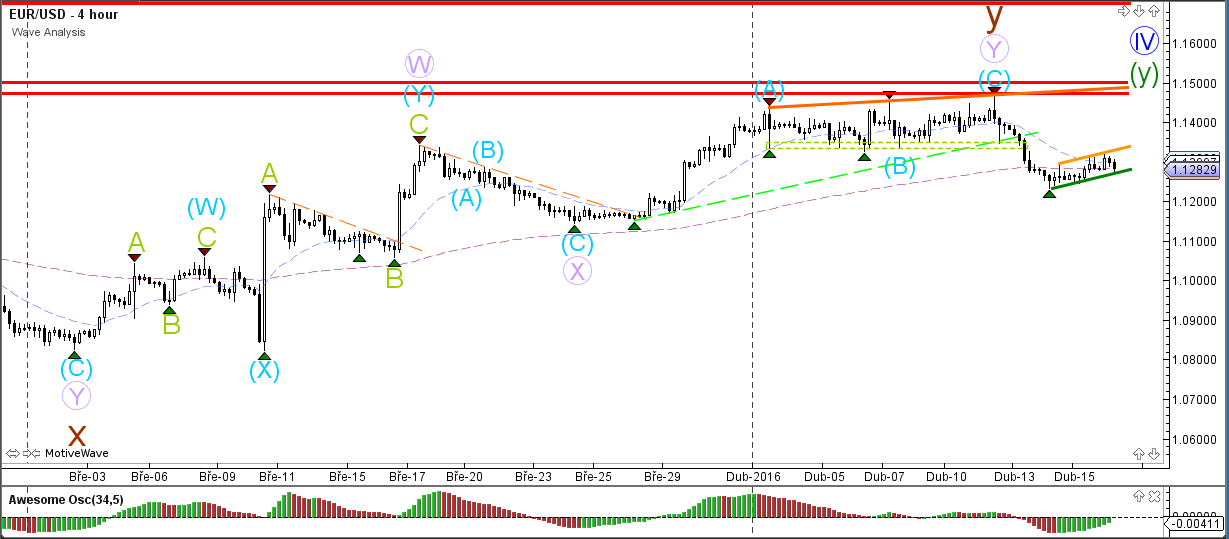
The EUR/USD is building a small bear flag chart pattern (orange and green trend lines). A bullish break could indicate that the larger wave 4 (blue) is still not completed. A bearish break of the bear flag could indicate that a larger retracement or even reversal (and completion of wave 4) is taking place.
1 hour
(Click on image to enlarge)
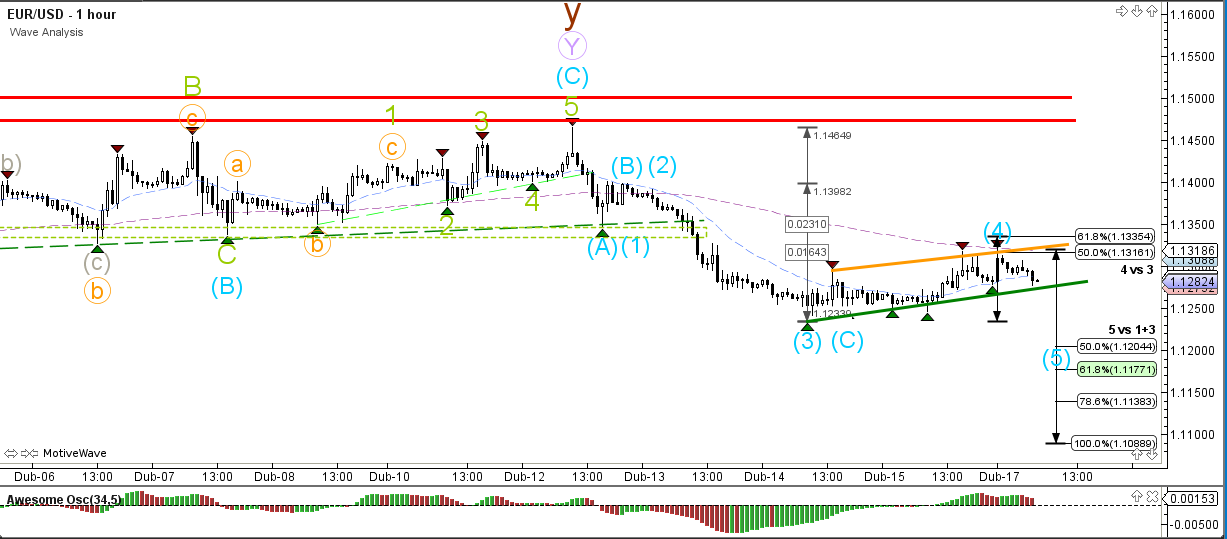
The EUR/USD chart is showing 2 wave possibilities. The main scenario is a bearish impulsive 5 wave which could occur when the bear flag breaks. The alternative is an ABC (blue) which seems more likely when there is a bullish break of the channel.
GBP/USD
4 hour
(Click on image to enlarge)
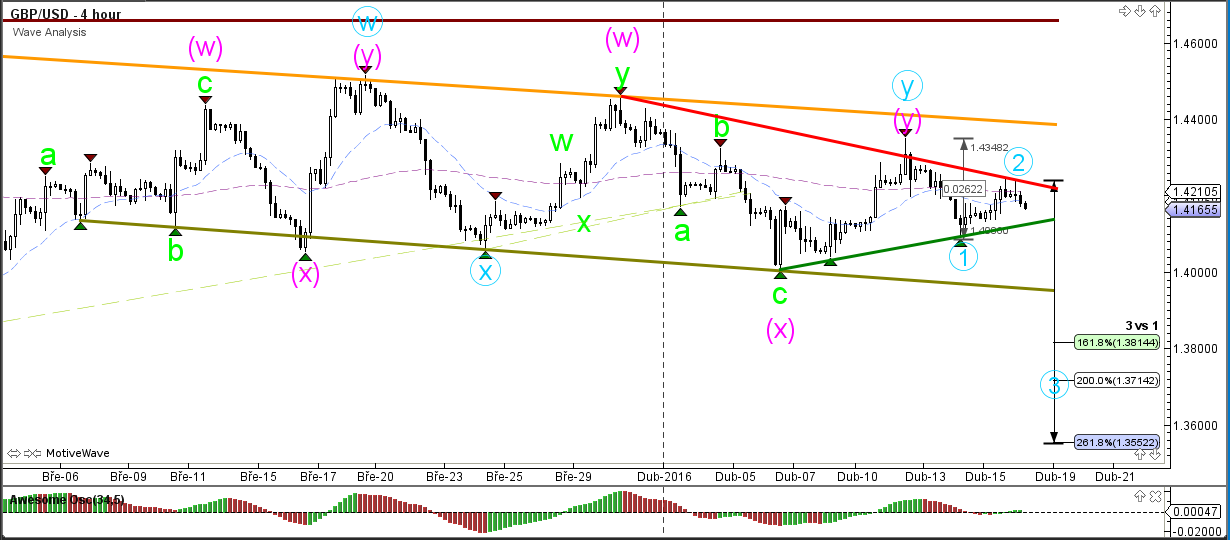
The GBP/USD is in a contracting triangle (green/red) chart pattern. The most likely wave count is a wave 1-2 (blue) but it would only become confirmed if price manages to at least break the support trend line (green). A break above the orange resistance line invalidates the wave count.
1 hour
(Click on image to enlarge)
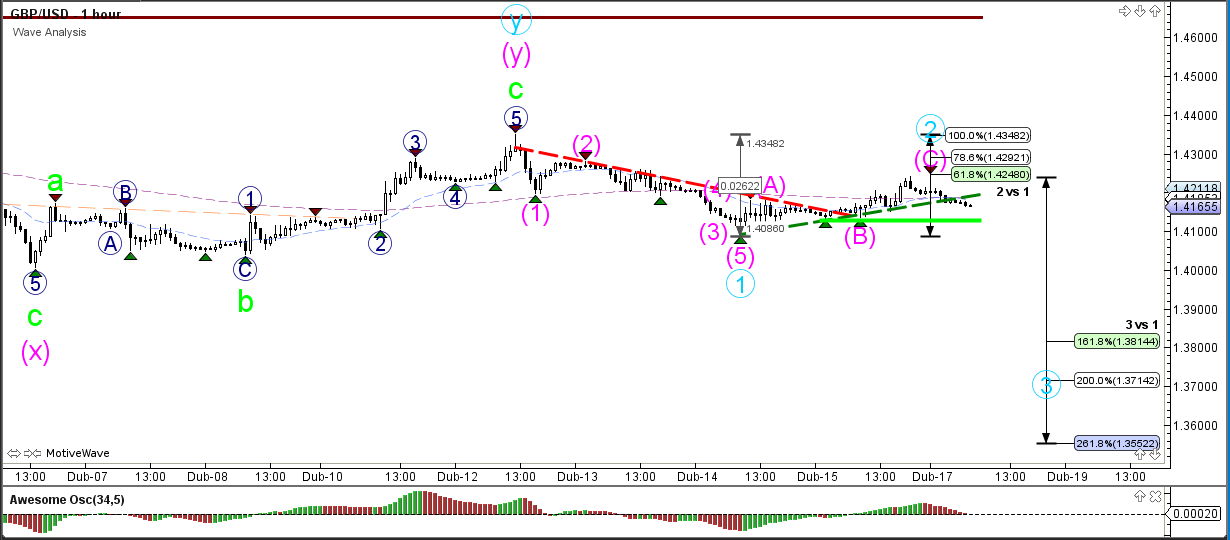
The GBP/USD could have completed a bullish ABC correction (pink) within wave 2 (blue) but a break below the horizontal support is needed before a bearish break below the trend line becomes more likely.
USD/JPY
4 hour
(Click on image to enlarge)
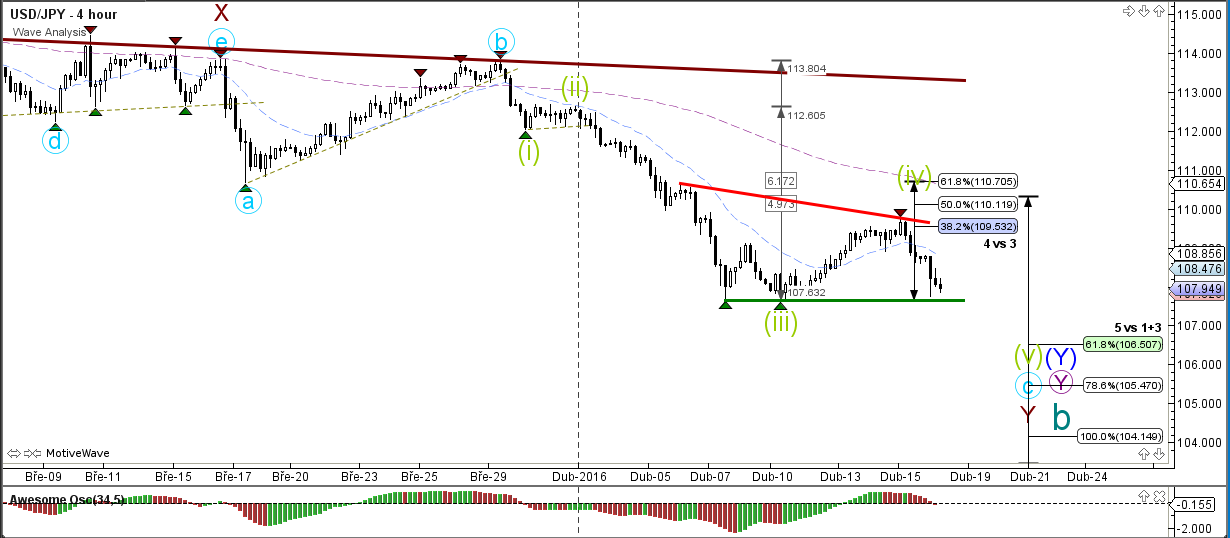
The USD/JPY made a bearish turn as indicated on Friday and bounced at the 38.2% Fibonacci level. Price is now retesting the bottom (green). A break below support could see price fall towards the Fibonacci targets of wave 5 (green). The 61.8% Fibonacci target is the main target because it is equal to the 38.2% Fibonacci level of wave B (sea green).
1 hour
(Click on image to enlarge)
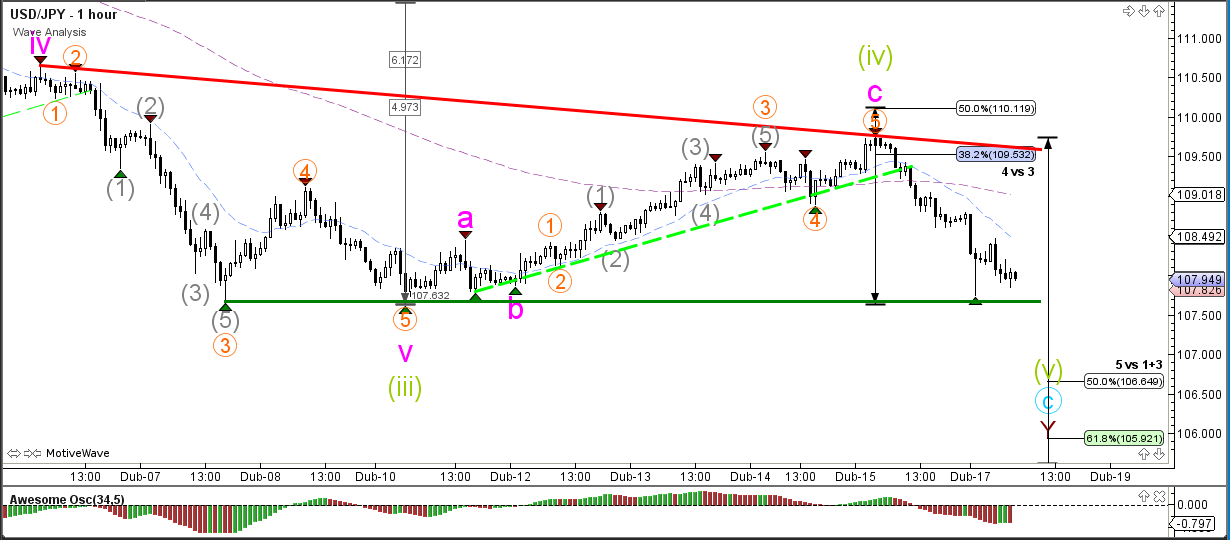
The USD/JPY broke below the support trend line (dotted green) but now needs to break horizontal support if the bearish momentum and trend is able to continue.

Comments
Log in or sign up to join the conversation.